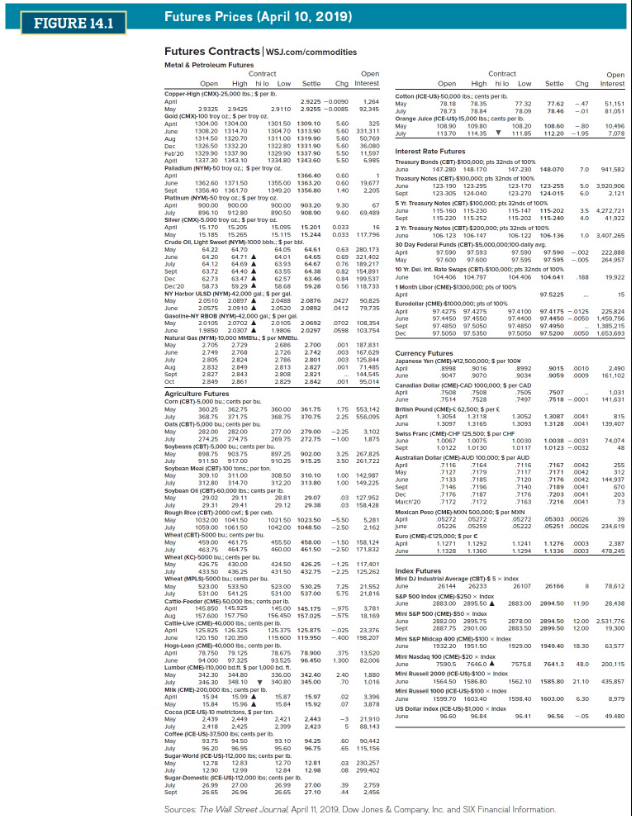
You are long 65 May 2019 cotton futures contracts. Calculate your dollar profit or loss from this trading day. (A negative value should be indicated by a minus sign. Do not round intermediate calculations.)
FIGURE 14.1 Futures Prices (April 10, 2019) Settle Cho Open Interest Contract Open High hilo Low Cotton CE-US-50.000 lbs: cents perib May 7818 78.35 77.32 787378.14 78.09 Orange Alice ICE-US)15,000 ts, cants per May 1080 109.30 100.20 11370114.35 111.85 78.46 51.151 81051 1088 - 10:49 7,078 980 De Interest Rate Futures Treasury Bonds (CBT) $100.000 plants of 100% une 147-280 168-170 147.230 148-070 941582 Treasury Notes (CBT)-100.00 pts 32nds or 100 123-130 123-29 123-170 123255 SD 3.520.000 Sopt 123.205 120.000 123-270 120015 2.121 St Treasury Notes (CRT) $100.000 phs 22nd of 100% 115-150 115-230 115-147 115-202 3.5 4.272.721 Sept 116.220 115.262 115.200 115200 2 Treasury Mots COT) $200.000 phands of June 106-123 106-147 106-122 105-136 103.607 265 30 Day Federal Funds CBT)-55.000.000,00-daly av. April 97.500 97593 57.500 97.590-002 222.819 May 97600 97.600 97.595 97 595-005 25495 10 Wr. Doint. Rato Swaps (CBT)-5100.000 ps 22nds of 100 104406 104797 104406 104641 19.922 1 Month Liber CHE-51300,000s of 100% Apr 15 Eurod CHE $1000.000s of 100% Apr 97.4275 97 4275 97.4100 97.4175 -0125225824 97.4450 97 4550 97.4400 97.4450-0050 1.450.756 97.4850 97 5050 Dec 97.5050 975350 97.6050 975200 0062 1.053.699 Currency Futures Japanese Yen (CMT) VI 100.000 per 100 April 9016 90150010 2.490 3047 9070 904 161.102 Canadian Dollar CMECAD 1000.000.5 per CAD April SOR 7500 7507 1031 .7520 7497 7518-0001 141.931 Bilan Pound CD & 02.100 Apri 1.2054 13118 13007 0041 815 1.2007 1.3165 30 0041 139407 Swiss Franc CHECHT 135 500 $ per CHF 10075 10038-0031 74074 10130 10111 10123 -0032 48 Australian Dollar (CME AUD 100.000 per AUD April .7116 716 7116 7167 0012 266 May 7127 7117 71710042 312 .7133 .7185 7120 7176 0042 144937 .7146 7196 7140 71890041 Dec 7167 7176 72030041 203 Marco .7172 7172 7163 7216 0041 73 Mexican POLO (CMS) NON 100,000: $ per MN 05272 05272 06272 6530300026 05226 0526 06222 05251 00026 224519 Euro CNG CO.000; 5 perc 1.1271 1.1292 11241 1.1276 0003 2.387 1.1320 1.1360 11330 .0003 470245 Pure 75 Futures Contracts/WSj.com/commodities Metal & Petroleum Futures Contract Open Open High hilo low Sotto che interest Copper-High CMX 25.000 18:$pe. April 2.9325 2.905 2.9225 -0.000 1.254 2.91102.925 -0.000 92.36 Gold (CHX-100 woors per troyer April 1304.00 1301.00 130150 1100.10 5.60 325 130820 181420 130470 1313.90 5.60 331311 Aug 1314.50 132070 131100 1319.30 5.60 50.769 Der 1326.50 183220 132280 1331.50 5.60 38.000 Feb20 1329.90 1337 90 132990 1337.90 5.50 11.597 1337.20 124310 123480 1243.60 6.95 Palladium NYM-50 to oz: Sperry Apri 1366.40 1962.60 137150 1355.00 1363.20 06019677 Sept 1356.40 136170 1349 20 1354.00 1.40 2.205 Protinum NYM-50 typertroy 90000 900.00 90000 903,20 JU 296.10 01280 89050 98.00 Silver (CM-5.000 try oSperry April 15.170 15205 16.00 16201 0.02 16 May 15.185 15205 15. 115 15.244 0.033117395 Crude Oil, Light Sweet NW 1000 bel part 6422 54.70 6405 64.61 0.63 280.173 June 6420 64.71 A 6401 4. G.EE 121.402 6393 64.67 0.76 1927 Sept 63.72 6440 A 63.55 0.82 154.891 62736347 A 6257 63.46 0:84 199537 Dec 20 5873 92 868 58.28 0.56 118.733 NY Harbor SD NYM42.000 pl 2.0510 20A 2.0483 2.08760427 90 2.0576 2.0010 A 2.0620 200920412 7073 Gasoline-NY ROB NYM-42.000 gal: pergal 20105 2.0702 A 2.0106 2.0012 OTO010025 June 19850 2.0307 A 1.9806 2.0297 0598 103.754 Natural Gas NM10,000 MMUS per MIVEL May 2705 2720 266 2.700 001 187831 June 2740 2700 2726 2.742 003 167.629 2624 2.70 2001 003125.844 2802 2049 2813 00171485 Sapt 2937 24 2.900 2849 2821 101 Oct .001 95014 Agriculture Futures Com CBT) 5.000 buccants per bu May 362.75 36000 1.75 553.142 3587537175 370.75 2.25 556.005 Cats (CBT)-5.000 bucets per bu May 262.00 277.00 270.00 3.102 27425 27475 269.5 272.75 -100 1825 Seytans (CBT)-5.000 cents per bu May 1985 90375 89725 902.00 3.25 267825 911.50 17.00 91025 915.25 350 2012 Soybean Meal CBT) 400 tons porton 309.10 31100 308.50 310.10 100 142.987 31280 314.70 31220313.80 100 149.225 Soybean OCBT)-60.000 lbs. con perib. 2931 2941 Rough Rice CBT) 2000 Wt: perch 103200 104150 102150 1023.50 -5.50 5.281 1050.00 106150 104200 1068.50 -2.50 2.162 Wheat (CBT)-5000 bucents per bu May 459.00 461.75 466.50 458.00 -1.50 158.124 46375 46475 46000 461.50 -2.50 171832 Wheat C-5000 bucets per bu 4575 124.50 -1.25 117401 July 43350 49525 431.50 432.75 -2.25 125.262 Wheat (MPL) 5000 buscents per bu 52300 5350 52300 530.25 21552 July 5310054125 53100 537.00 5.75 21.816 Carti Foeder (ME) 50.000 scoperit April 145.850 145.25 145.00 145.173 157600 157.750 156.050 157025 18.169 Cauve CE-0.000 Scers per i April 125.825 126.225 125.375 125 875 -035 22.276 120.150 120 350 119.600 119.950 -100 Hoge-Lean (CM) 40,000 lbs, cents per i All 78750 78.900 13520 June 94.000 97.325 93.525 96.450 1.300 82.000 Lumber CME 190.000 bat por 1.000 bd. May 34230 344.30 336.00 342.40 2.40 2460 34810340 80 345.00 .90 1015 MI CME)-200.000 , cents per I. 1594 15.99 A 15.07 My 1534 15. A 15.84 Cocoa (ICE US motrictons, perton 2439 2.449 2421 -3 21910 2.418 2.309 5 88.143 Coffee ICE-US1-37.500 bosatts per May 92.75 94.50 5042 9620 95.60 65 115.156 Sugar World CE-US-12.000 cents per a May 1278 1220 12.01 ca 230.257 12.90 12.99 12.04 Sugar Dame CE-US-12.000 boscos per 2699 27.00 27.00 2759 Sept 26 26 27.10 10025 0122 19 e Art -515 Index Futures Mini DJ Industrial Average (CT) $5 Index 26144 26233 26107 2016 3 78612 SEP O Index ICE 5250 x Index 2083.00 2095.50 A 2083.00 2094.50 11.90 28.43 MS&P 500CME)-S80 x Index June 22.00 2995,75 2878.00 2904.50 1200 2501.776 288775 2901.00 2683.50 209.50 1200 Min SAP Midcap 400 CME-S100 x index June 1932.20 1951.50 1923.00 1943.60 Mini Nasdaq 100 CME-520 index 7500S 7GICO 7575 7641 400 200115 Mind Russell 2000 ICE-US) $100 Index 156450 1586.80 1562.10 1585.80 2110 435 857 Min Russel 1000 ICE-US-S100 x 1990.70 1802.40 1503.40 1803.00 8.379 US Dollar in ICE-US-1.000 de 06.14 Sources: The Wall Street Journal April 11 2019. Dow Jones & Company, Inc and SIX Financial Information


