Answered step by step
Verified Expert Solution
Link Copied!

Question

1 Approved Answer

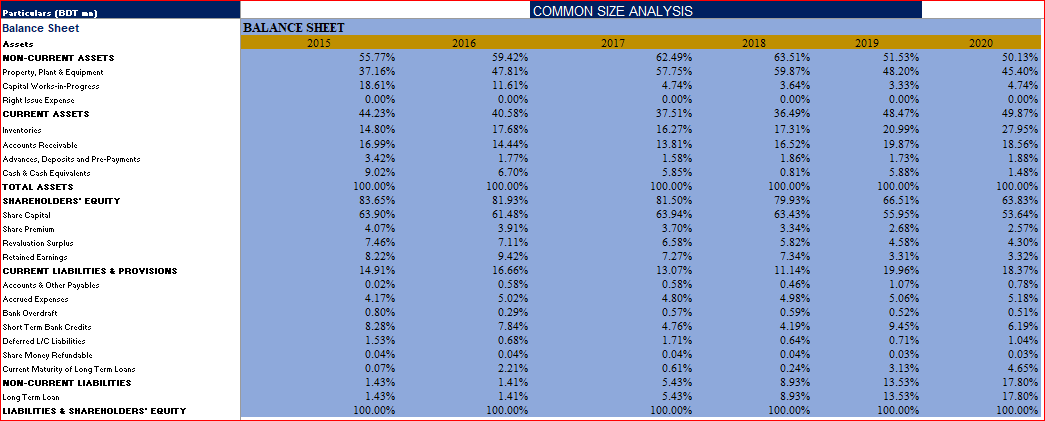
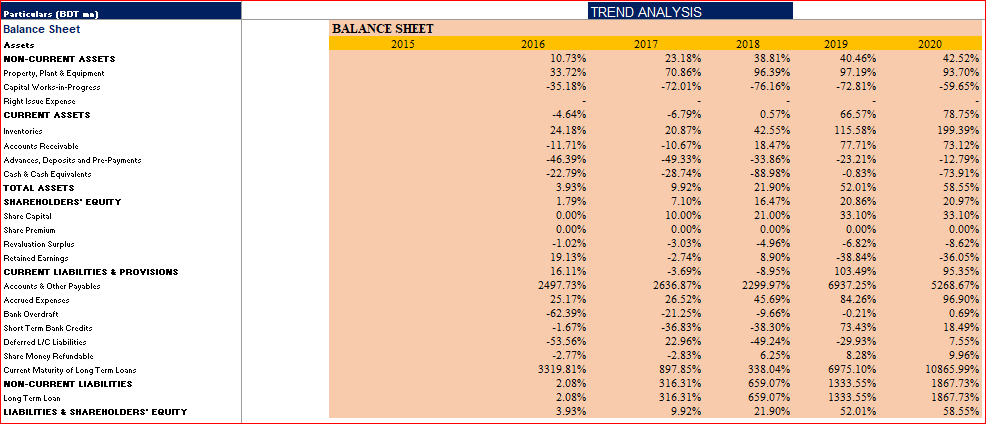
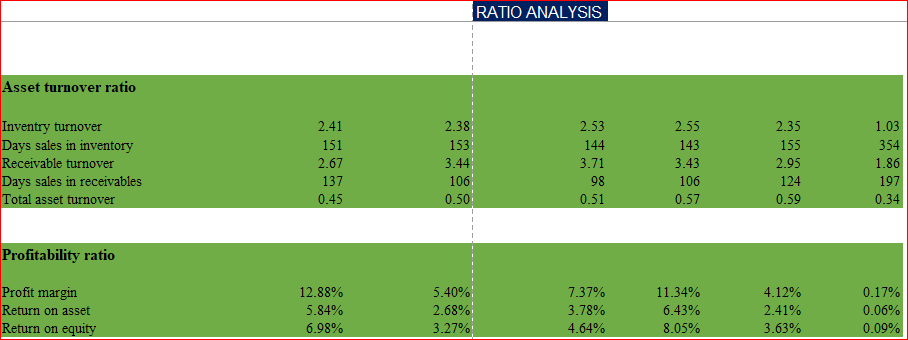
You are requested to add interpretation in each section of the screenshots by stating the company's financial health. Particulars (BDT mn) COMMON SIZE ANALYSIS 2016

You are requested to add interpretation in each section of the screenshots by stating theimage text in transcribedimage text in transcribedimage text in transcribedimage text in transcribedimage text in transcribedimage text in transcribedimage text in transcribed company's financial health.

Particulars (BDT mn) COMMON SIZE ANALYSIS 2016 2017 2018 2020 Sales Revenue Cost of Goods Sold Gross Profit Administrative & Selling Expenses Operating Profit Other Income Profit before Financial Expenses Financial Expenses Net Profit Before Tax and WPWFs Workers' Participation/Welfare Funds Net Profit Before Tax Current Tax Deferred Tax Provision for Income Tax INCOME STATEMENT 2015 100.00% 78.65% 21.35% 5.73% 15.62% 4.66% 20.28% 5.72% 14.56% 0.69% 13.86% 0.99% 0.00% 0.99% 12.88% 100.00% 84.98% 15.02% 6.04% 8.98% 4.66% 13.64% 6.91% 6.73% 0.32% 6.41% 1.00% 0.00% 1.00% 5.40% 100.00% 80.41% 19.59% 7.88% 11.71% 2.76% 14.47% 4.70% 9.77% 0.52% 9.25% 0.89% 0.99% 1.88% 7.37% 100.00% 77.86% 22.14% 8.11% 14.03% 3.32% 17.35% 4.05% 13.30% 0.03% 13.27% 0.90% 1.03% 1.93% 11.34% 2019 100.00% 84.23% 15.77% 6.94% 8.83% 2.37% 11.21% 5.30% 5.91% 0.03% 5.88% 0.46% 1.30% 1.76% 4.12% 100.00% 83.60% 16.40% 9.23% 7.16% 3.98% 11.15% 8.81% 2.33% 0.03% 2.30% 0.91% 1.22% 2.12% 0.17% Net Profit After Tax COMMON SIZE ANALYSIS BALANCE SHEET 2015 2016 2017 Particolars (BDT) Balance Sheet Assets HOH-CURRENT ASSETS Property, Plant & Equipment Capital Works-in-Progress Right Ioue Expense CURRENT ASSETS Inventories Accounts Receivable Advances, Deposits and Pre-Payments Cash & Cooh Equivalents TOTAL ASSETS SHAREHOLDERS' EQUITY Share Capital Share Premium Revaluation Surplus Retained Earnings CURREHT LIABILITIES & PROVISIONS Accounts & Other Payables Accrued Expenses Bank Overdraft Short Term Bank Credits Deferred L/C Liabilities Share Moncy Refundable Current Maturity of Long Term Loans HOH-CURRENT LIABILITIES Long Term Loon LIABILITIES # SHAREHOLDERS' EQUITY 55.77% 37.16% 18.61% 0.00% 44.23% 14.80% 16.99% 3.42% 9.02% 100.00% 83.65% 63.90% 4.07% 7.46% 8.22% 14.91% 0.02% 4.17% 0.80% 8.28% 1.53% 0.04% 0.07% 1.43% 1.43% 100.00% 59.42% 47.81% 11.61% 0.00% 40.58% 17.68% 14.44% 1.77% 6.70% 100.00% 81.93% 61.48% 3.91% 7.11% 9.42% 16.66% 0.58% 5.02% 0.29% 7.84% 0.68% 0.04% 2.21% 1.41% 1.41% 100.00% 62.49% 57.75% 4.74% 0.00% 37.51% 16.27% 13.81% 1.58% 5.85% 100.00% 81.50% 63.94% 3.70% 6.58% 7.27% 13.07% 0.58% 4.80% 0.57% 4.76% 1.71% 0.04% 0.61% 5.43% 5.43% 100.00% 2018 63.51% 59.87% 3.64% 0.00% 36.49% 17.31% 16.52% 1.86% 0.81% % 100.00% 79.93% 63.43% 3.34% 5.82% 7.34% 11.14% 0.46% 4.98% 0.59% 4.19% 0.64% 0.04% 0.24% 8.93% 8.93% 100.00% 2019 51.53% 48.20% 3.33% 0.00% 48.47% 20.99% 19.87% 1.73% 5.88% 100.00% 66.51% 55.95% 2.68% 4.58% 3.31% 19.96% 1.07% 5.06% 0.52% 9.45% 0.71% 0.03% 3.13% 13.53% 13.53% 100.00% 2020 50.13% 45.40% 4.74% 0.00% 49.87% 27.95% 18.56% 1.88% 1.48% 100.00% 63.83% 53.64% 2.57% 4.30% 3.32% 18.37% 0.78% 5.18% 0.51% 6.19% 1.04% 0.03% 4.65% 17.80% 17.80% 100.00% TREND ANALYSIS BALANCE SHEET 2015 Particolars (BDT BD Balance Sheet Assets HOH-CURRENT ASSETS Property, Plant & Equipment Capital Works-in-Progress Right Issue Expense CURREHT ASSETS 2016 10.73% 33.72% -35.18% 2017 23.18% 70.86% -72.01% 2018 38.81% 96.39% -76.16% 2019 40.46% 97.19% -72.81% 2020 42.52% 93.70% -59.65% Inventories Accounts Receivable Advances, Deposits and Pre-Payments Cash & Cash Equivalents TOTAL ASSETS SHAREHOLDERS' EQUITY Share Capital Share Premium Revaluation Surplus Retained Earning CURRENT LIABILITIES & PROVISIONS Accounts & Other Payables Accrued Expenses Bank Overdraft Short Term Bank Credits Deferred L/C Liabilities Share Moncy Refundable Current Maturity of Long Term Loans HOH-CURRENT LIABILITIES Long Term Loon LIABILITIES # SHAREHOLDERS' EQUITY -4.64% 24.18% -11.71% -46.39% -22.79% 3.93% 1.79% 0.00% 0.00% -1.02% 19.13% 16.11% 2497.73% 25.17% -62.39% -1.67% -53.56% -2.77% 3319.81% 2.08% 2.08% 3.93% -6.79% 20.87% -10.67% -49.33% -28.74% 9.92% 7.10% 10.00% 0.00% -3.03% -2.74% -3.69% 2636.87% 26.52% -21.25% -36.83% 22.96% -2.83% 897.85% 316.31% 316.31% 9.92% 0.57% 42.55% 18.47% -33.86% -88.98% 21.90% 16.47% 21.00% 0.00% -4.96% 8.90% -8.95% 2299.97% 45.69% -9.66% -38.30% -49.24% 6.25% 338.04% 659.07% 659.07% 21.90% 66.57% 115.58% 77.71% -23.21% -0.83% 52.01% 20.86% 33.10% 0.00% -6.82% -38.84% 103.49% 6937.25% 84.26% -0.21% 73.43% -29.93% 8.28% 6975.10% 1333.55% 1333.55% 52.01% 78.75% 199.39% 73.12% -12.79% -73.91% 58.55% 20.97% 33.10% 0.00% -8.62% -36.05% 95.35% 5268.67% 96.90% % 0.69% 18.49% 7.55% 9.96% 10865.99% 1867.73% 1867.73% 58.55% Particulars (BDT mn) TREND ANALYSIS INCOME STATEMENT 2015 Sales Revenue Cost of Goods Sold Gross Profit Administrative & Selling Expenses Operating Profit Other Income Profit before Financial Expenses Financial Expenses Net Profit Before Tax and WPWFs Workers' Participation/Welfare Funds Net Profit Before Tax Current Tax Deferred Tax Provision for Income Tax 2016 13.62% 22.77% -20.06% 19.85% -34.69% 13.65% -23.59% 37.22% -47.48% -47.48% -47.48% 15.82% 2017 24.20% 26.98% 13.97% 70.80% -6.87% -26.42% -11.36% 2.13% -16.66% -6.89% -17.15% 11.80% 2018 52.38% 50.84% 58.05% 115.79% 36.87% 8.75% 30.42% 7.97% 39.24% -93.47% 45.87% 38.55% 2019 96.39% 110.32% 45.09% 137.81% 11.08% 0.03% 8.54% 81.95% -20.30% -92.11% -16.71% -7.70% 2020 20.39% 27.96% -7.52% 94.06% -44.77% 2.94% -33.81% 85.54% -80.71% -94.12% -80.04% 10.81% 15.82% -52.32% 136.52% -28.92% 198.17% 34.21% 251.32% -37.23% 159.35% -98.37% Net Profit After Tax RATIO ANALYSIS 2017 2015 2016 2018 2019 2020 Short term solvency ratio Current Ratio Quick ratio Cash ratio 2.97 1.97 0.60 2.44 1.37 0.40 2.87 1.63 0.45 3.28 1.72 0.07 2.43 1.38 0.29 2.71 1.19 0.08 Long term solvency ratio Total debt ratio Debt to equity ratio Equity multiplier 0.16 0.20 1.20 0.18 0.22 1.22 0.18 0.23 1.23 0.20 0.25 1.25 0.33 0.50 1.50 0.36 0.57 1.57 RATIO ANALYSIS Asset turnover ratio Inventry turnover Days sales in inventory Receivable turnover Days sales in receivables Total asset turnover 2.41 151 2.67 137 0.45 2.38 153 3.44 106 0.50 2.53 144 3.71 98 0.51 2.55 143 3.43 106 0.57 2.35 155 2.95 124 0.59 1.03 354 1.86 197 0.34 Profitability ratio Profit margin Return on asset Return on equity 12.88% 5.84% 6.98% 5.40% 2.68% 3.27% 7.37% 3.78% 4.64% 11.34% 6.43% 8.05% 4.12% 2.41% 3.63% 0.17% 0.06% 0.09% DU PONT IDENTITY 2015 2016 2017 2018 2019 2020 ROE= Net profit/Total equity ROE-Return on asset*equity multiplier ROE=Profit margin*equity multiplier*total asset turnover 6.98% 6.98% 6.98% 3.27% 3.27% 3.27% 4.64% 4.64% 4.64% 8.05% 8.05% 8.05% 3.63% 3.63% 3.63% 0.09% 0.09% 0.09% Particulars (BDT mn) COMMON SIZE ANALYSIS 2016 2017 2018 2020 Sales Revenue Cost of Goods Sold Gross Profit Administrative & Selling Expenses Operating Profit Other Income Profit before Financial Expenses Financial Expenses Net Profit Before Tax and WPWFs Workers' Participation/Welfare Funds Net Profit Before Tax Current Tax Deferred Tax Provision for Income Tax INCOME STATEMENT 2015 100.00% 78.65% 21.35% 5.73% 15.62% 4.66% 20.28% 5.72% 14.56% 0.69% 13.86% 0.99% 0.00% 0.99% 12.88% 100.00% 84.98% 15.02% 6.04% 8.98% 4.66% 13.64% 6.91% 6.73% 0.32% 6.41% 1.00% 0.00% 1.00% 5.40% 100.00% 80.41% 19.59% 7.88% 11.71% 2.76% 14.47% 4.70% 9.77% 0.52% 9.25% 0.89% 0.99% 1.88% 7.37% 100.00% 77.86% 22.14% 8.11% 14.03% 3.32% 17.35% 4.05% 13.30% 0.03% 13.27% 0.90% 1.03% 1.93% 11.34% 2019 100.00% 84.23% 15.77% 6.94% 8.83% 2.37% 11.21% 5.30% 5.91% 0.03% 5.88% 0.46% 1.30% 1.76% 4.12% 100.00% 83.60% 16.40% 9.23% 7.16% 3.98% 11.15% 8.81% 2.33% 0.03% 2.30% 0.91% 1.22% 2.12% 0.17% Net Profit After Tax COMMON SIZE ANALYSIS BALANCE SHEET 2015 2016 2017 Particolars (BDT) Balance Sheet Assets HOH-CURRENT ASSETS Property, Plant & Equipment Capital Works-in-Progress Right Ioue Expense CURRENT ASSETS Inventories Accounts Receivable Advances, Deposits and Pre-Payments Cash & Cooh Equivalents TOTAL ASSETS SHAREHOLDERS' EQUITY Share Capital Share Premium Revaluation Surplus Retained Earnings CURREHT LIABILITIES & PROVISIONS Accounts & Other Payables Accrued Expenses Bank Overdraft Short Term Bank Credits Deferred L/C Liabilities Share Moncy Refundable Current Maturity of Long Term Loans HOH-CURRENT LIABILITIES Long Term Loon LIABILITIES # SHAREHOLDERS' EQUITY 55.77% 37.16% 18.61% 0.00% 44.23% 14.80% 16.99% 3.42% 9.02% 100.00% 83.65% 63.90% 4.07% 7.46% 8.22% 14.91% 0.02% 4.17% 0.80% 8.28% 1.53% 0.04% 0.07% 1.43% 1.43% 100.00% 59.42% 47.81% 11.61% 0.00% 40.58% 17.68% 14.44% 1.77% 6.70% 100.00% 81.93% 61.48% 3.91% 7.11% 9.42% 16.66% 0.58% 5.02% 0.29% 7.84% 0.68% 0.04% 2.21% 1.41% 1.41% 100.00% 62.49% 57.75% 4.74% 0.00% 37.51% 16.27% 13.81% 1.58% 5.85% 100.00% 81.50% 63.94% 3.70% 6.58% 7.27% 13.07% 0.58% 4.80% 0.57% 4.76% 1.71% 0.04% 0.61% 5.43% 5.43% 100.00% 2018 63.51% 59.87% 3.64% 0.00% 36.49% 17.31% 16.52% 1.86% 0.81% % 100.00% 79.93% 63.43% 3.34% 5.82% 7.34% 11.14% 0.46% 4.98% 0.59% 4.19% 0.64% 0.04% 0.24% 8.93% 8.93% 100.00% 2019 51.53% 48.20% 3.33% 0.00% 48.47% 20.99% 19.87% 1.73% 5.88% 100.00% 66.51% 55.95% 2.68% 4.58% 3.31% 19.96% 1.07% 5.06% 0.52% 9.45% 0.71% 0.03% 3.13% 13.53% 13.53% 100.00% 2020 50.13% 45.40% 4.74% 0.00% 49.87% 27.95% 18.56% 1.88% 1.48% 100.00% 63.83% 53.64% 2.57% 4.30% 3.32% 18.37% 0.78% 5.18% 0.51% 6.19% 1.04% 0.03% 4.65% 17.80% 17.80% 100.00% TREND ANALYSIS BALANCE SHEET 2015 Particolars (BDT BD Balance Sheet Assets HOH-CURRENT ASSETS Property, Plant & Equipment Capital Works-in-Progress Right Issue Expense CURREHT ASSETS 2016 10.73% 33.72% -35.18% 2017 23.18% 70.86% -72.01% 2018 38.81% 96.39% -76.16% 2019 40.46% 97.19% -72.81% 2020 42.52% 93.70% -59.65% Inventories Accounts Receivable Advances, Deposits and Pre-Payments Cash & Cash Equivalents TOTAL ASSETS SHAREHOLDERS' EQUITY Share Capital Share Premium Revaluation Surplus Retained Earning CURRENT LIABILITIES & PROVISIONS Accounts & Other Payables Accrued Expenses Bank Overdraft Short Term Bank Credits Deferred L/C Liabilities Share Moncy Refundable Current Maturity of Long Term Loans HOH-CURRENT LIABILITIES Long Term Loon LIABILITIES # SHAREHOLDERS' EQUITY -4.64% 24.18% -11.71% -46.39% -22.79% 3.93% 1.79% 0.00% 0.00% -1.02% 19.13% 16.11% 2497.73% 25.17% -62.39% -1.67% -53.56% -2.77% 3319.81% 2.08% 2.08% 3.93% -6.79% 20.87% -10.67% -49.33% -28.74% 9.92% 7.10% 10.00% 0.00% -3.03% -2.74% -3.69% 2636.87% 26.52% -21.25% -36.83% 22.96% -2.83% 897.85% 316.31% 316.31% 9.92% 0.57% 42.55% 18.47% -33.86% -88.98% 21.90% 16.47% 21.00% 0.00% -4.96% 8.90% -8.95% 2299.97% 45.69% -9.66% -38.30% -49.24% 6.25% 338.04% 659.07% 659.07% 21.90% 66.57% 115.58% 77.71% -23.21% -0.83% 52.01% 20.86% 33.10% 0.00% -6.82% -38.84% 103.49% 6937.25% 84.26% -0.21% 73.43% -29.93% 8.28% 6975.10% 1333.55% 1333.55% 52.01% 78.75% 199.39% 73.12% -12.79% -73.91% 58.55% 20.97% 33.10% 0.00% -8.62% -36.05% 95.35% 5268.67% 96.90% % 0.69% 18.49% 7.55% 9.96% 10865.99% 1867.73% 1867.73% 58.55% Particulars (BDT mn) TREND ANALYSIS INCOME STATEMENT 2015 Sales Revenue Cost of Goods Sold Gross Profit Administrative & Selling Expenses Operating Profit Other Income Profit before Financial Expenses Financial Expenses Net Profit Before Tax and WPWFs Workers' Participation/Welfare Funds Net Profit Before Tax Current Tax Deferred Tax Provision for Income Tax 2016 13.62% 22.77% -20.06% 19.85% -34.69% 13.65% -23.59% 37.22% -47.48% -47.48% -47.48% 15.82% 2017 24.20% 26.98% 13.97% 70.80% -6.87% -26.42% -11.36% 2.13% -16.66% -6.89% -17.15% 11.80% 2018 52.38% 50.84% 58.05% 115.79% 36.87% 8.75% 30.42% 7.97% 39.24% -93.47% 45.87% 38.55% 2019 96.39% 110.32% 45.09% 137.81% 11.08% 0.03% 8.54% 81.95% -20.30% -92.11% -16.71% -7.70% 2020 20.39% 27.96% -7.52% 94.06% -44.77% 2.94% -33.81% 85.54% -80.71% -94.12% -80.04% 10.81% 15.82% -52.32% 136.52% -28.92% 198.17% 34.21% 251.32% -37.23% 159.35% -98.37% Net Profit After Tax RATIO ANALYSIS 2017 2015 2016 2018 2019 2020 Short term solvency ratio Current Ratio Quick ratio Cash ratio 2.97 1.97 0.60 2.44 1.37 0.40 2.87 1.63 0.45 3.28 1.72 0.07 2.43 1.38 0.29 2.71 1.19 0.08 Long term solvency ratio Total debt ratio Debt to equity ratio Equity multiplier 0.16 0.20 1.20 0.18 0.22 1.22 0.18 0.23 1.23 0.20 0.25 1.25 0.33 0.50 1.50 0.36 0.57 1.57 RATIO ANALYSIS Asset turnover ratio Inventry turnover Days sales in inventory Receivable turnover Days sales in receivables Total asset turnover 2.41 151 2.67 137 0.45 2.38 153 3.44 106 0.50 2.53 144 3.71 98 0.51 2.55 143 3.43 106 0.57 2.35 155 2.95 124 0.59 1.03 354 1.86 197 0.34 Profitability ratio Profit margin Return on asset Return on equity 12.88% 5.84% 6.98% 5.40% 2.68% 3.27% 7.37% 3.78% 4.64% 11.34% 6.43% 8.05% 4.12% 2.41% 3.63% 0.17% 0.06% 0.09% DU PONT IDENTITY 2015 2016 2017 2018 2019 2020 ROE= Net profit/Total equity ROE-Return on asset*equity multiplier ROE=Profit margin*equity multiplier*total asset turnover 6.98% 6.98% 6.98% 3.27% 3.27% 3.27% 4.64% 4.64% 4.64% 8.05% 8.05% 8.05% 3.63% 3.63% 3.63% 0.09% 0.09% 0.09%

Step by Step Solution

There are 3 Steps involved in it

Step: 1

blur-text-image

Get Instant Access to Expert-Tailored Solutions

See step-by-step solutions with expert insights and AI powered tools for academic success

Step: 2

blur-text-image

Step: 3

blur-text-image

Ace Your Homework with AI

Get the answers you need in no time with our AI-driven, step-by-step assistance

Get Started

Recommended Textbook for

Value Investing

Authors: Mike Hartley

1st Edition

ISBN: 979-8864443309

More Books

Students also viewed these Finance questions

Question

5. What should the firm have done differently?

Answered: 1 week ago