Answered step by step
Verified Expert Solution
Question
1 Approved Answer
You are required to design a spreadsheet to help a portfolio manager carry out the analysis of the US equity market. The spreadsheet you


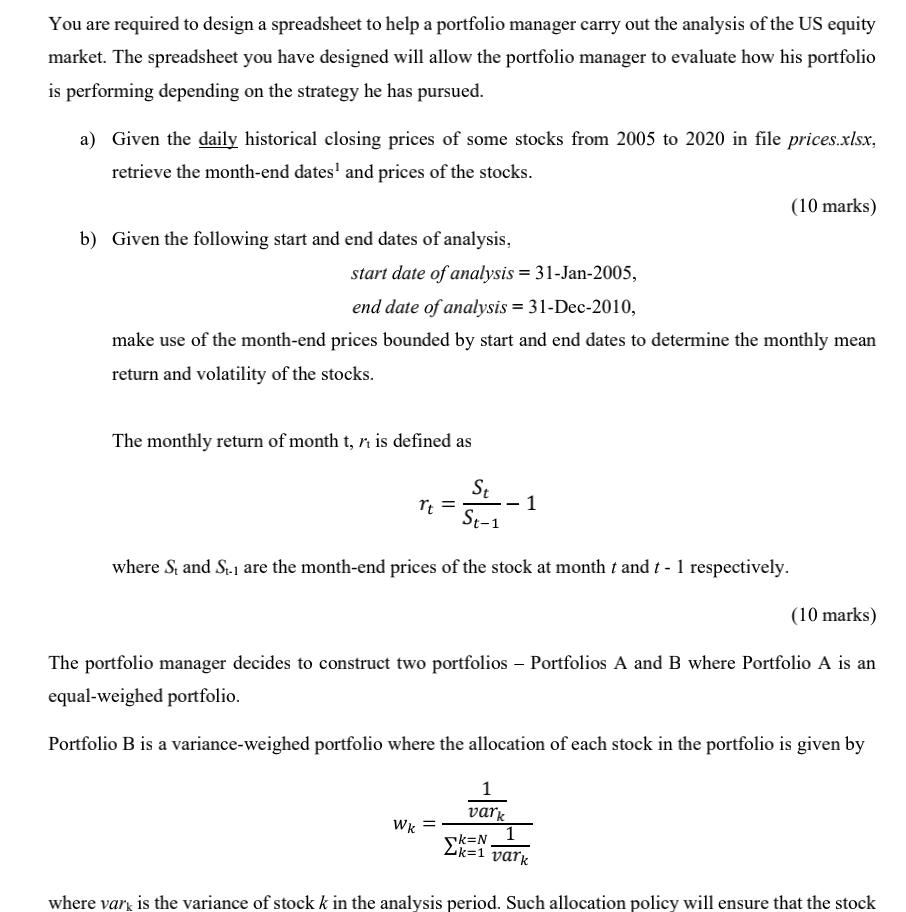
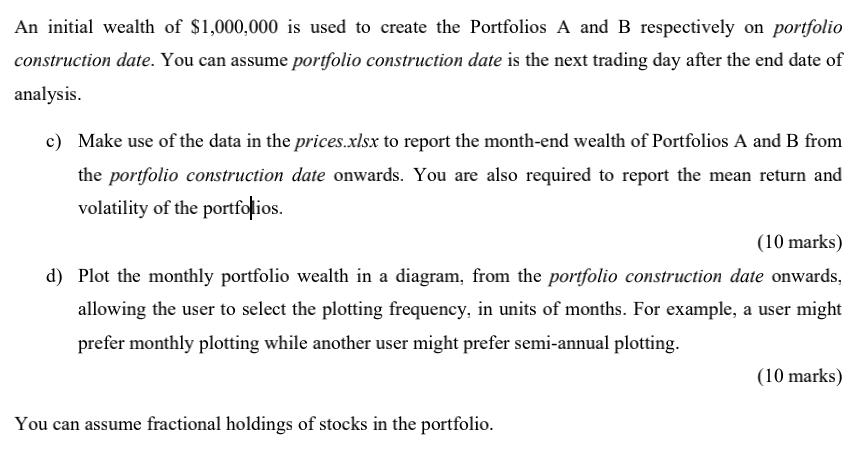
You are required to design a spreadsheet to help a portfolio manager carry out the analysis of the US equity market. The spreadsheet you have designed will allow the portfolio manager to evaluate how his portfolio is performing depending on the strategy he has pursued. a) Given the daily historical closing prices of some stocks from 2005 to 2020 in file prices.xlsx, retrieve the month-end dates and prices of the stocks. b) Given the following start and end dates of analysis, start date of analysis = 31-Jan-2005, end date of analysis = 31-Dec-2010, make use of the month-end prices bounded by start and end dates to determine the monthly mean return and volatility of the stocks. The monthly return of month t, is defined as St St-1 where S, and S.1 are the month-end prices of the stock at month t and t - 1 respectively. (10 marks) = t = 1 (10 marks) The portfolio manager decides to construct two portfolios - Portfolios A and B where Portfolio A is an equal-weighed portfolio. Wk Portfolio B is a variance-weighed portfolio where the allocation of each stock in the portfolio is given by 1 k=N vark 1 k=1 vark where vark is the variance of stock k in the analysis period. Such allocation policy will ensure that the stock An initial wealth of $1,000,000 is used to create the Portfolios A and B respectively on portfolio construction date. You can assume portfolio construction date is the next trading day after the end date of analysis. c) Make use of the data in the prices.xlsx to report the month-end wealth of Portfolios A and B from the portfolio construction date onwards. You are also required to report the mean return and volatility of the portfolios. (10 marks) d) Plot the monthly portfolio wealth in a diagram, from the portfolio construction date onwards, allowing the user to select the plotting frequency, in units of months. For example, a user might prefer monthly plotting while another user might prefer semi-annual plotting. You can assume fractional holdings of stocks in the portfolio. (10 marks)
Step by Step Solution
★★★★★
3.41 Rating (164 Votes )
There are 3 Steps involved in it
Step: 1
To assist the portfolio manager with the analysis of the US equity market using the providedpricesxl...
Get Instant Access to Expert-Tailored Solutions
See step-by-step solutions with expert insights and AI powered tools for academic success
Step: 2

Step: 3

Ace Your Homework with AI
Get the answers you need in no time with our AI-driven, step-by-step assistance
Get Started


