
You are required to do the following:
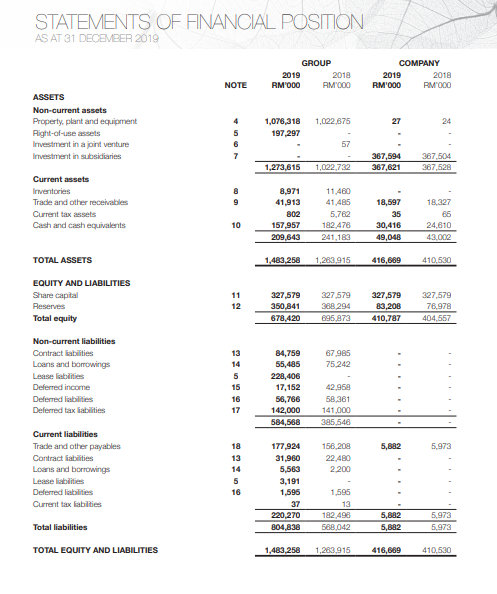
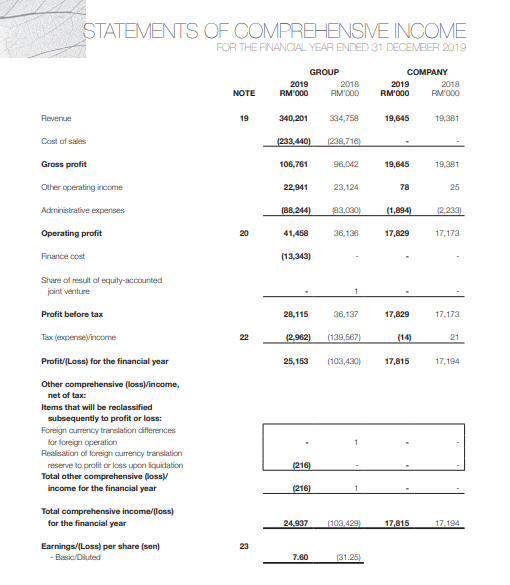
1. Calculate the following financial ratios for PBA Holdings according to 2019 report.
Take the value of GROUP
a.) LIQUIDITY RATIO:
- Current ratio
- Quick ratio
b.) ASSET MANAGEMENT RATIO:
- Fixed Asset Turnover
- Total Asset Turnover
c,) PROFITABILITY RATIO:
- Net Profit Margin
- Return on Assets
- Return on Equity
d.) LEVERAGE RATIO:
- Debt Ratio
- Equity Ratio
STATEMENTS OF FINANCIAL POSITION AS AT 31 DECEMBER 2013 GROUP 2019 2018 RM000 RM1000 COMPANY 2019 2018 RM'000 RM OOO NOTE 1,022,675 27 24 ASSETS Non-current assets Property, plant and equipment Right-of-use assets Investment in a joint venture Investment in subsidiaries 4 5 6 1,078,318 197,297 57 367,594 367,621 1,022,732 367,504 367,528 1,273,615 Current assets Inventories Trade and other receivables Current tax assets Cash and cash equivalents B 9 8.971 41.913 802 157 957 209,643 11,460 41,485 5,762 182.478 241,183 18,597 35 30,416 49,048 18.327 66 24,610 43.002 10 TOTAL ASSETS 1,483,258 1,263.915 416,689 410,630 EQUITY AND LIABILITIES Share capital Reserves Total equity 11 12 327,579 350,841 678,420 327.579 388.294 895.873 327,579 83,206 410,787 327,579 76,978 404,557 67.985 75.242 Non-current liabilities Contract abilities Loans and borrowings Lease liabilities Deferred income Deferred liabilities Deferred tax liabilities 13 14 5 15 16 17 84,759 55,485 228,406 17,152 56,766 142,000 584,568 42.968 58,361 141,000 385,546 5,882 5,973 Current liabilities Trade and other payables Contract liabilities Loans and borrowings Leaselbilities Deferred liabilities Current tax liabilities 18 13 14 5 16 156,208 22.480 2.200 177,924 31,960 5,563 3,191 1.595 37 220,270 804,838 1,595 13 182.498 588,042 5,882 5,882 5.973 5,973 Total liabilities TOTAL EQUITY AND LIABILITIES 1,483,258 1,283,915 416,669 410.530 STATEMENTS OF COMPREHENSIVE INCOME FOR THE FINANCIAL YEAR ENDED 31 DECEMBER 2019 GROUP COMPANY 2018 RM 000 2019 NOTE 2018 RM1000 2019 RM000 RM1000 Revenue 19 340,201 334,758 19,645 19,381 Cast of sales (233.440) (228,716) 106,761 96,042 19,645 19,381 Gross profit Other operating income 22,941 23,124 78 25 Administrative expenses (88,244) 183,030) (1,894) (2.233 Operating profit 20 41,458 36,138 17,829 17.173 Finance cost (13,343) Share of result of equity-accounted joint venture Profit before tax 28, 115 36,137 17,829 17.173 Tax (expense income 22 (2.962) (139,587) (14) 21 25,153 (103,430) 17,815 17.194 Profit/(Loss) for the financial year Other comprehensive (loss/income, net of tax: Items that will be reclassified subsequently to profit or loss: Foreign currency translation differences for foreign operation Realisation of foreign currency translation reserve to profit or loss upon liquidation Total other comprehensive (loss) income for the financial year (216) (216) Total comprehensive income/loss) for the financial year 24.937 (103.4291 17,815 17.194 23 Earnings/(Loss) per share (sen) Basic/Dluted 7.60 (31.25)


