

You are required to do the following:
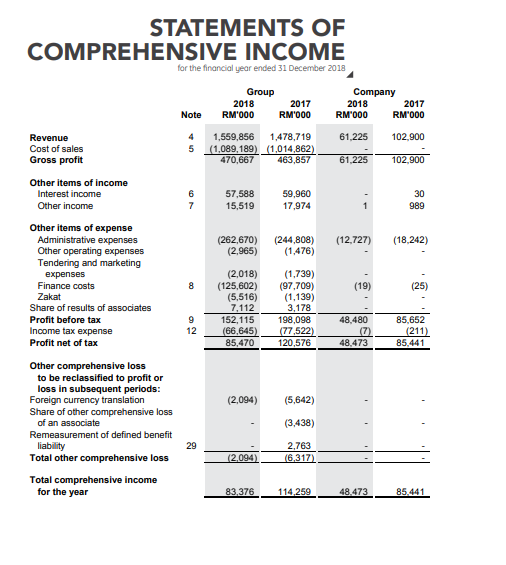
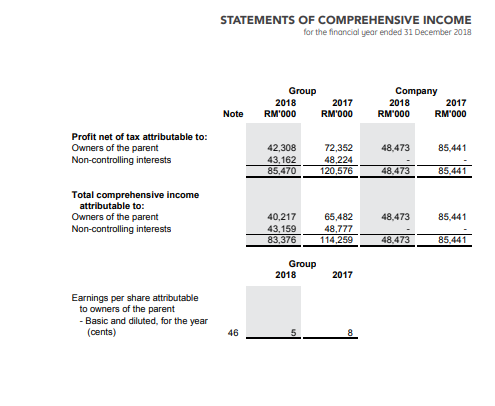
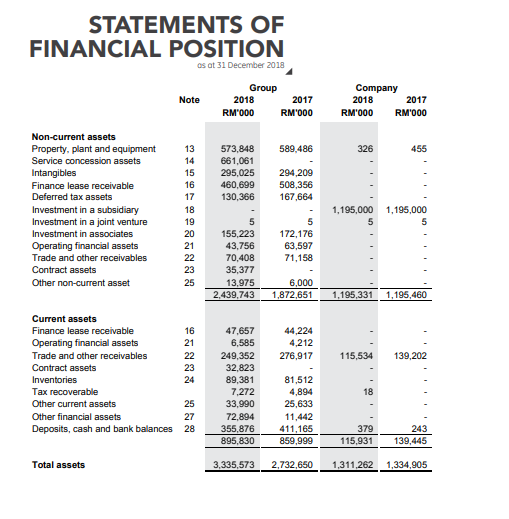
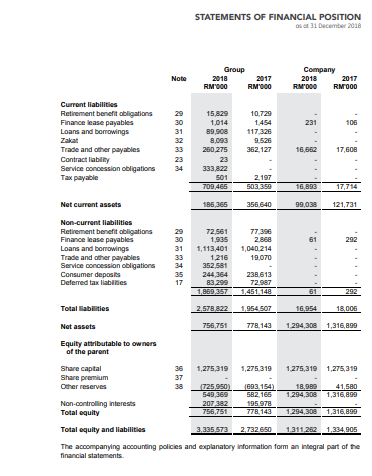
1. Calculate the following financial ratios for Ranhill company according to 2018 report:
a.) LIQUIDITY RATIO:
- Current ratio
- Quick ratio
b.) ASSET MANAGEMENT RATIO:
- Fixed Asset Turnover
- Total Asset Turnover
c.) PROFITABILITY RATIO:
- Net Profit Margin
- Return on Assets
- Return on Equity
d.) LEVERAGE RATIO:
- Debt Ratio
- Equity Ratio
2017 STATEMENTS OF COMPREHENSIVE INCOME for the financial year ended 31 December 2013 Group Company 2018 2017 2018 Note RM'000 RM'000 RM1000 RM"000 Revenue 4 1,559,856 1,478,719 61.225 102,900 Cost of sales 5 (1,089,189) (1.014,862) Gross profit 470,667 463,857 61,225 102.900 Other items of income Interest income 6 57,588 59,960 30 Other income 7 15,519 17,974 1 989 (12.727) (262,670) (2,965) (244,808) (1,476) (18,242) Other items of expense Administrative expenses Other operating expenses Tendering and marketing expenses Finance costs Zakat Share of results of associates Profit before tax Income tax expense Profit net of tax 8 (19) (25) (2,018) (125,602) (5,516) 7,112 152,115 (66,645) 85,470 (1,739) (97,709) (1,139) 3,178 198,098 (77,522) 120,576 9 12 48.480 (7) 48,473 85,652 (211) 85,441 (2,094) (5,642) Other comprehensive loss to be reclassified to profit or loss in subsequent periods: Foreign currency translation Share of other comprehensive loss of an associate Remeasurement of defined benefit liability Total other comprehensive loss (3.438) 29 2,763 (6.317) (2,094 Total comprehensive income for the year 83,376 114.259 48.473 85.441 STATEMENTS OF COMPREHENSIVE INCOME for the financial year ended 31 December 2018 Group 2018 2017 RM'000 RM'000 Company 2018 2017 RM1000 RM'000 Note Profit net of tax attributable to: Owners of the parent Non-controlling interests 48,473 85,441 42,308 43,162 85,470 72,352 48,224 120,576 48.473 85,441 Total comprehensive income attributable to: Owners of the parent Non-controlling interests 48.473 85,441 40,217 43,159 83,376 65,482 48,777 114,259 48,473 85,441 Group 2018 2017 Earnings per share attributable to owners of the parent - Basic and diluted, for the year (cents) 46 STATEMENTS OF FINANCIAL POSITION os at 31 December 2018 Note Group 2018 2017 RM'000 RM'000 Company 2018 2017 RM'000 RM8000 589,486 326 455 573,848 661,061 295,025 460,699 130,366 294,209 508,356 167,664 Non-current assets Property, plant and equipment Service concession assets Intangibles Finance lease receivable Deferred tax assets Investment in a subsidiary Investment in a joint venture Investment in associates Operating financial assets Trade and other receivables Contract assets Other non-current asset 13 14 15 16 17 18 19 20 21 22 23 25 1,195,000 5 1,195,000 5 5 155.223 43,756 70,408 35,377 13,975 2.439,743 5 172,176 63,597 71,158 6.000 1,872,651 1,195,331 1,195,460 44,224 4,212 276,917 115,534 139,202 Current assets Finance lease receivable 16 Operating financial assets 21 Trade and other receivables 22 Contract assets 23 Inventories 24 Tax recoverable Other current assets 25 Other financial assets 27 Deposits, cash and bank balances 28 47.657 6,585 249,352 32,823 89,381 7,272 33,990 72,894 355,876 895,830 18 81,512 4,894 25,633 11,442 411,165 859,999 379 115,931 243 139,445 Total assets 3,335,573 2,732,650 1,311,262 1,334,905 STATEMENTS OF FINANCIAL POSITION s at 31 December 2018 Note Group 2018 2017 RM 000 RM 000 Company 2018 2017 RM000 RM000 1454 31 501 31 Current liabilities Retirement benefit obligations 15.829 10.729 Finance lease payables 1,014 231 106 Loans and borrowings 89.908 117,325 8,093 9.526 Trade and other payables 250 275 362.127 16,662 17,608 Contract liability Service concession obligations 333,822 Tax payable 2.197 703,465 50.350 16.03 Net current assets 186,365 356.640 99,038 121,731 Non-current liabilities Retirement benefit obligations 72.561 77.390 Finance lease payables 30 1,935 2.368 61 292 Loans and borrowings 1,113,401 1,040.214 Trade and other payables 33 1216 19.070 Service concession obligations 34 352 581 Consumer deposits 244,364 238,613 Deferred tax liabies 17 83.299 72.987 1,869 357 61 292 Total liabilities 2.578,822 1,954 507 16.954 18,006 Net assets 756,751 778.143 1.294,308 1,316,899 Equity attributable to owners of the parent Share capital 36 1,275,319 1,275,319 1.275,319 1.275, 319 Share premium 37 Other reserves 38 (725.950) 693 154) 18,989 41.580 549,369 582.166 1.294,308 1,316,899 Non-controlling interests 207 382 195.978 Total equity 756,751 778.143 1.294,308 1,316,899 Total equity and liabilities 3,335,573 2.732.650 1311,262 1,334,905 The accompanying accounting policies and explanatory information form an integral part of the financial statements


