

You are required to do the following:
1. Calculate the following financial ratios for PBA Holdings according to 2017 report.
a.) LIQUIDITY RATIO:
- Current ratio
- Quick ratio
b.) ASSET MANAGEMENT RATIO:
- Fixed Asset Turnover
- Total Asset Turnover
c,) PROFITABILITY RATIO:
- Net Profit Margin
- Return on Assets
- Return on Equity
d.) LEVERAGE RATIO:
- Debt Ratio
- Equity Ratio
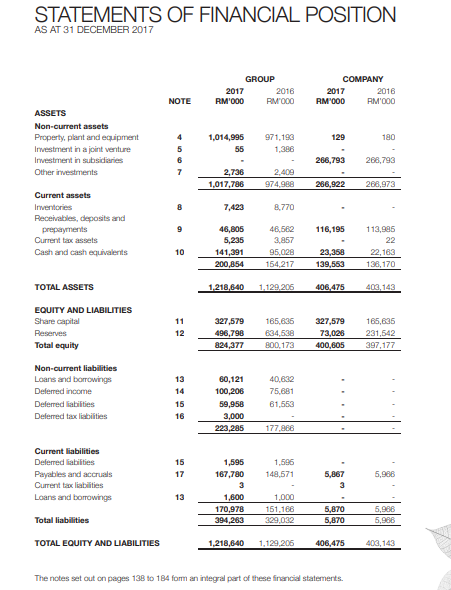
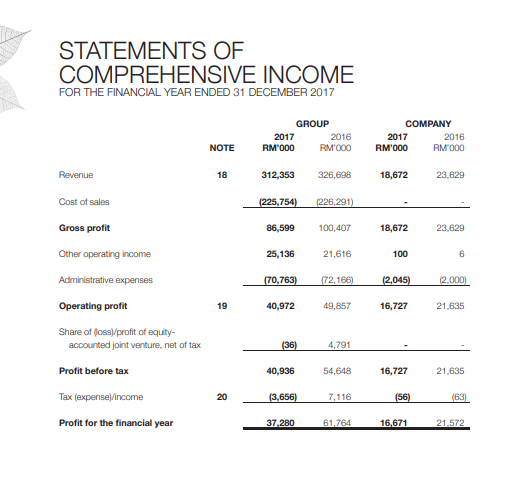
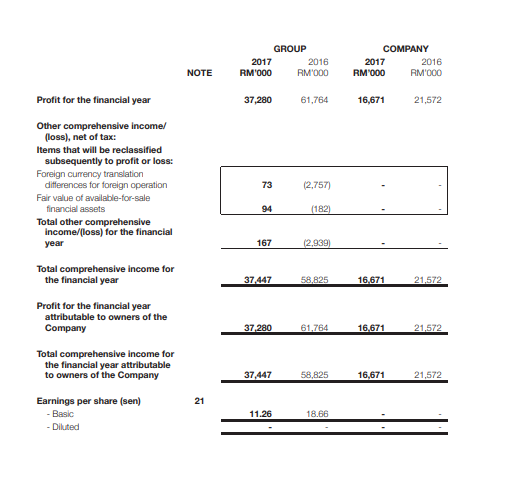
STATEMENTS OF FINANCIAL POSITION AS AT 31 DECEMBER 2017 GROUP 2017 2016 RM'000 MOOO COMPANY 2017 2016 RM'000 RM'000 NOTE 129 180 ASSETS Non-current assets Property, plant and equipment Investment in a joint venture Investment in subsidiaries Other investments 1,014,995 55 971.190 1,388 5 6 7 266,793 288,793 2,736 1,017,786 2.400 974,988 266,922 288,973 8 7,423 8.770 Current assets Inventories Receivables, deposits and prepayments Current tax assets Cash and cash equivalents 9 116,195 46,805 5,235 141,391 200,854 48,562 3,857 95,028 154,217 10 113,985 22 22,163 138,170 23,358 139,553 TOTAL ASSETS 1.218,840 1.129,206 406,475 403, 143 EQUITY AND LIABILITIES Share capital Reserves Total equity 11 12 327,579 496,798 824,377 165,636 634,538 800,173 327,579 73,026 400,605 165,635 231,542 397,177 13 Non-current liabilities Loans and borrowings Deferred income Deferred liabilities Deferred tax liabilities 80,121 100,206 59,958 3,000 40.632 75,681 61,553 15 16 223,285 177,856 Current liabilities Deferred liabilities Payables and accruals Current tax liabilities Loans and borrowings 15 17 1,596 148,571 5,867 5,986 1,595 167,780 3 1,800 170,978 394,263 13 1.000 151.168 329,032 5,870 5,870 5,986 5,986 Total liabilities TOTAL EQUITY AND LIABILITIES 1,218,6-40 1,129,206 406,475 403,143 The notes set out on pages 138 to 184 fom an integral part of these financial statements. STATEMENTS OF COMPREHENSIVE INCOME FOR THE FINANCIAL YEAR ENDED 31 DECEMBER 2017 GROUP 2017 2016 RM OOO RM'000 COMPANY 2017 2016 RM'000 RM1000 NOTE Revenue 18 312,353 326,698 18,672 23,629 Cost of sales (225,754) (226,291) Gross profit 86,599 100,407 18,672 23,629 25,136 21,616 100 6 (70,763) (72,166 12,045) (2.000) 19 40,972 49,857 16,727 21,635 Other operating income Administrative expenses Operating profit Share of loss/profit of equity- accounted joint venture, net of tax Profit before tax Tax (expense)/income Profit for the financial year (36) 4,791 40,936 54,648 16,727 21.635 20 (3,656) 7,116 (56) (63) 37.280 61,764 16,671 21.572 GROUP 2017 2016 RM'000 RM'000 COMPANY 2017 2016 RM 000 RM'000 NOTE Profit for the financial year 37,280 61.764 16,671 21,572 Other comprehensive incomel (loss), net of tax: Items that will be reclassified subsequently to profit or loss: Foreign currency translation differences for foreign operation Fair value of available for sale financial assets Total other comprehensive income/loss) for the financial year 73 (2.757) 94 (182) 167 (2.939) Total comprehensive income for the financial year 37.447 58,825 16,671 21,572 Profit for the financial year attributable to owners of the Company 37,280 61,764 16.671 21,572 Total comprehensive income for the financial year attributable to owners of the Company 37,447 58,825 16,671 21,572 21 Earnings per share (sen) - Basic - Diluted 11.26 18.66


