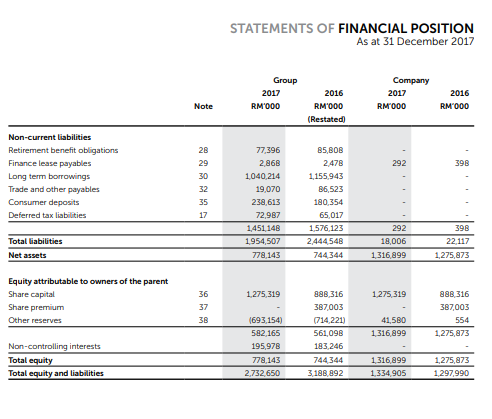
You are required to do the following:
- Calculate the following financial ratios for the Ranhill Holdings company according to 2017 report:
a.) LIQUIDITY RATIO:
- Current ratio
- Quick ratio
b.) ASSET MANAGEMENT RATIO:
- Fixed Asset Turnover
- Total Asset Turnover
c.) PROFITABILITY RATIO:
- Net Profit Margin
- Return on Assets
- Return on Equity
d.) LEVERAGE RATIO:
- Debt Ratio
- Equity Ratio
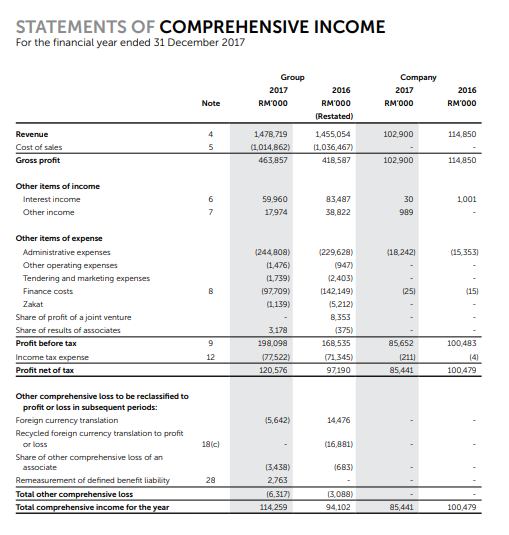
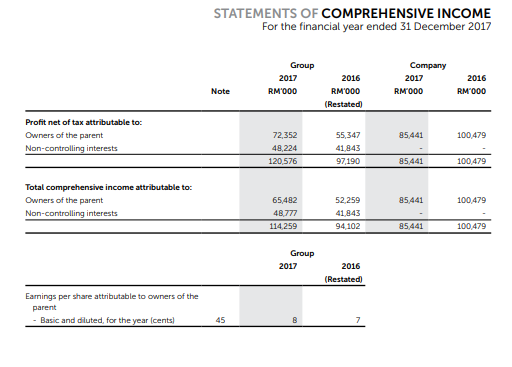
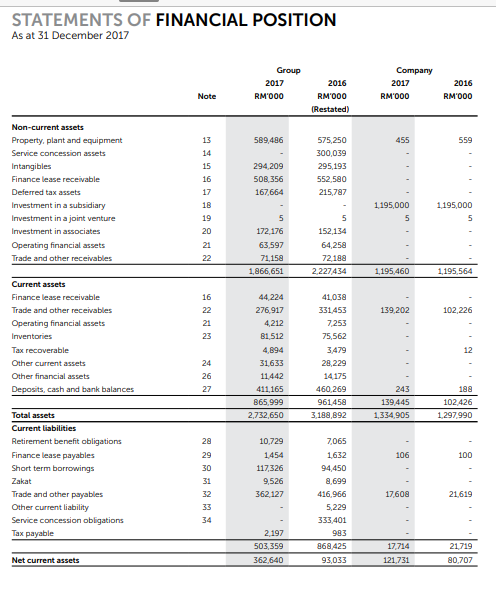
STATEMENTS OF COMPREHENSIVE INCOME For the financial year ended 31 December 2017 Group 2017 RM'000 Company 2017 RM'000 2016 RM'000 Note 2016 RM'000 (Restated) 1.455,054 (1,036,467 418,587 102.900 114,850 Revenue Cost of sales Gross profit 5 1478,719 (1,014,B62) 463,857 102.900 114,850 Other items of income Interest income Other income 1001 6 7 59,960 17,974 834a7 38,822 30 989 (18.2421 (15 3531 (244,802) 11.476) 11,739) 197 709) (1,139) B 1251 Other items of expense Administrative expenses Other operating expenses Tendering and marketing expenses Finance costs Zakat Share of profit of a joint venture Share of results of associates Profit before tax Income tax expense Profit net of tax (151 (229,628) 1947) 12,403) (142,149) 15,212) B.353 (375) 16.535 (71.345) 97190 9 3.178 198,098 177522) 120,576 12 95 652 (211) 85,441 100,483 (4) 100,479 (5,642) 14,476 12 cl (16,881) Other comprehensive loss to be reclassified to profit or loss in subsequent periods: Foreign currency translation Recycled foreign currency translation to profit or loss Share of other comprehensive loss of an associate Remeasurement of defined benefit liability Total other comprehensive loss Total comprehensive income for the year (683) 28 3.438) 2.763 16,317) 114259 13.088) 94 102 85,441 100,479 STATEMENTS OF COMPREHENSIVE INCOME For the financial year ended 31 December 2017 Group 2017 RM'000 Company 2017 RM000 2016 RM'000 (Restated) 2016 RM'000 Note Profit net of tax attributable to Owners of the parent Non-controlling interests 85441 100479 72,352 48,224 120,576 55,347 41.843 97.190 85,441 100479 Total comprehensive income attributable to: Owners of the parent Non-controlling interests 85441 100,479 65,482 48.777 114.259 52,259 41 843 94.102 85 441 100479 Group 2017 2016 (Restated Earnings per share attributable to owners of the parent - Basic and diluted, for the year (cents 45 STATEMENTS OF FINANCIAL POSITION As at 31 December 2017 Group 2017 RM'000 Company 2017 RM'000 2016 RM'000 (Restated) Note 2016 RM'OOO 589,486 455 559 Non-current assets Property, plant and equipment Service concession assets Intangibles Finance lease receivable Deferred tax assets Investment in a subsidiary Investment in a joint venture Investment in associates Operating financial assets Trade and other receivables 13 14 15 16 17 18 19 20 294,209 50B 356 167,664 575,250 300,039 295,193 552,500 215,787 1.195,000 5 1195,000 5 5 172 176 21 22 63,597 71.15a 1,866,651 5 15 64,25a 72,188 2,227434 1.195,460 1,195,564 139,202 102,226 Current assets Finance lease receivable Trade and other receivables Operating financial assets Inventories Tax recoverable Other current assets Other financial assets Deposits, cash and bank balances 16 22 21 23 12 44.224 276,917 4,212 B1 512 4,894 31,633 11442 411,165 865,999 2.732,650 41,038 331,453 7.253 75,562 3,479 28, 229 14 175 460,269 961,45a 3,188,892 24 26 27 100 243 139,445 1,334,905 102.426 1,297,990 28 106 100 Total assets Current liabilities Retirement benefit obligations Finance lease payables Short term borrowings Zakat Trade and other payables Other current liability Service concession obligations Tax payable 29 30 31 10,729 1454 117,326 9,526 362 127 17,600 21,619 7,065 1632 94,450 2,699 416,966 5,229 333,401 983 868,425 93,033 33 34 2 197 503,359 362,640 17714 21719 80,707 Net current assets 121,731 STATEMENTS OF FINANCIAL POSITION As at 31 December 2017 Group 2017 RM'000 2016 Company 2017 RM000 2016 RM"000 Note RM'000 (Restated) 292 398 Non-current liabilities Retirement benefit obligations Finance lease payables Long term borrowings Trade and other payables Consumer deposits Deferred tax liabilities 2B 29 30 32 35 17 77,396 2,868 1,040,214 19,070 238,613 72.987 1,451 148 1954,507 778,143 B5,BOB 2478 1,155,943 B6,523 180,354 65,017 1,576,123 2.444546 744344 292 Total liabilities Net assets 18,006 1,316,899 398 22.117 1,275,873 1,275,319 1.275,319 Equity attributable to owners of the parent Share capital Share premium Other reserves 36 37 3B 88B 316 387003 (714,221) 561,098 183,246 744344 3.188.892 88B 316 387,003 554 1,275,873 41.580 1 316,899 (693,154) 582,165 195,978 778,143 2,732.650 Non-controlling interests Total equity Total equity and liabilities 1 316,899 1.334.905 1,275,873 1.297,990


