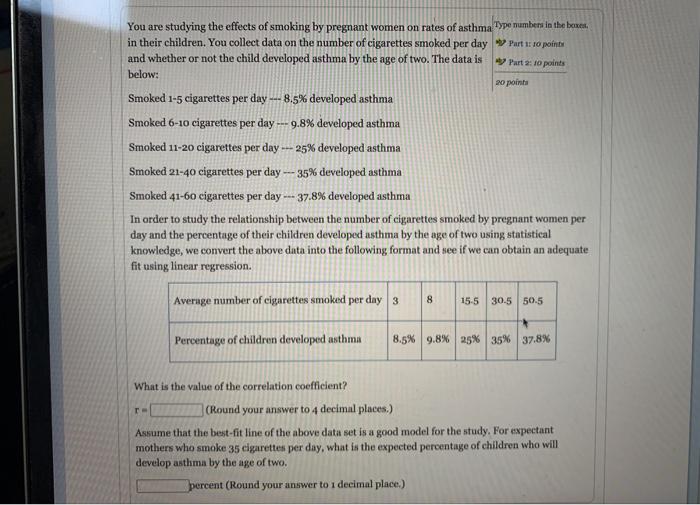
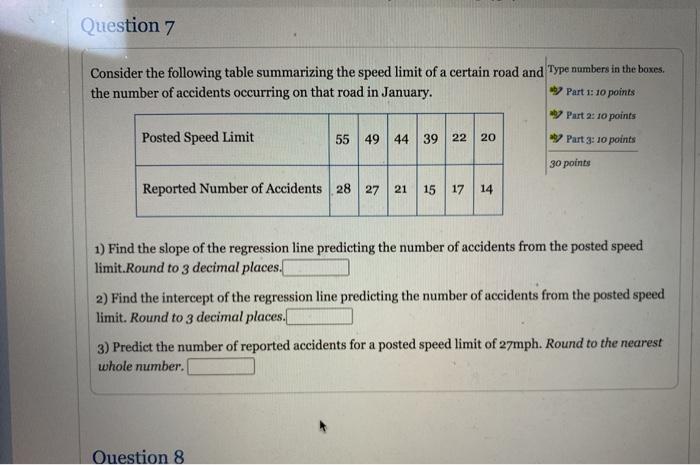
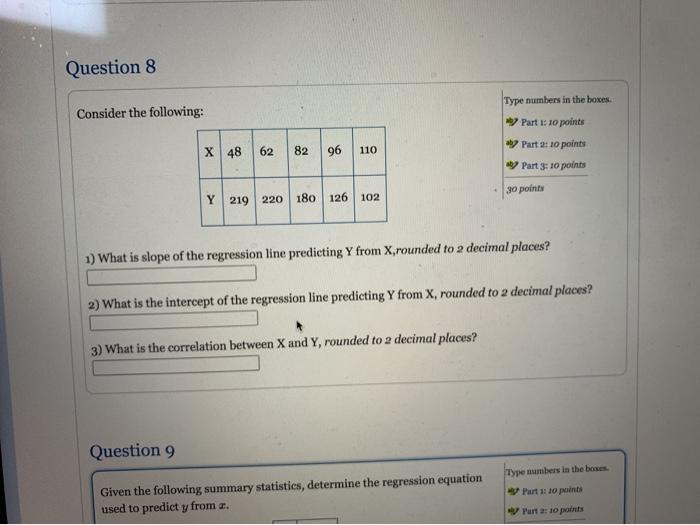
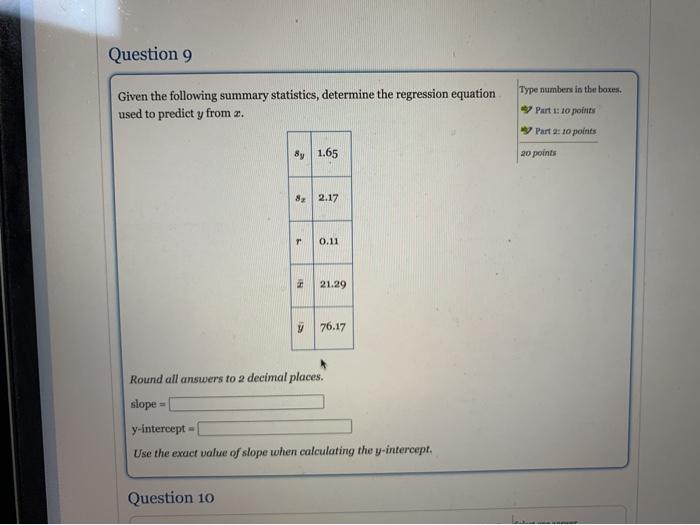
You are studying the effects of smoking by pregnant women on rates of asthma Type numbers in the boxes in their children. You collect data on the number of cigarettes smoked per day Part 1 10 point and whether or not the child developed asthma by the age of two. The data is Part 2: 10 points below: 20 points Smoked 1-5 cigarettes per day --- 8.5% developed asthma Smoked 6-10 cigarettes per day --- 9.8% developed asthma Smoked 11-20 cigarettes per day --- 25% developed asthma Smoked 21-40 cigarettes per day --- 35% developed asthma Smoked 41-60 cigarettes per day --- 37.8% developed asthma In order to study the relationship between the number of cigarettes smoked by pregnant women per day and the percentage of their children developed asthma by the age of two using statistical knowledge, we convert the above data into the following format and see if we can obtain an adequate fit using linear regression. Average number of cigarettes smoked per day 3 8 15.5 30.5 50.5 Percentage of children developed asthma 8.5% 9.8% 25% 35% 37.8% What is the value of the correlation coefficient? (Round your answer to 4 decimal places.) Assume that the best-fit line of the above data set is a good model for the study. For expectant mothers who smoke 35 cigarettes per day, what is the expected percentage of children who will develop asthma by the age of two. percent (Round your answer to 1 decimal place.) Question 7 Consider the following table summarizing the speed limit of a certain road and Type numbers in the boxes. the number of accidents occurring on that road in January. by Part 1:10 points by Part 2: 10 points Posted Speed Limit 55 49 44 39 22 Part 3: 10 points 30 points Reported Number of Accidents 28 27 21 15 17 14 20 1) Find the slope of the regression line predicting the number of accidents from the posted speed limit.Round to 3 decimal places. 2) Find the intercept of the regression line predicting the number of accidents from the posted speed limit. Round to 3 decimal places. 3) Predict the number of reported accidents for a posted speed limit of 27mph. Round to the nearest whole number. Question 8 Question 8 Type numbers in the boxes Consider the following: Part 1:10 points X 48 62 82 96 110 7 Part 2: 10 points B7 Part 3:10 points 30 points Y 219 220 180 126 102 1) What is slope of the regression line predicting Y from X,rounded to 2 decimal places? 2) What is the intercept of the regression line predicting Y from X, rounded to a decimal places? 3) What is the correlation between X and Y, rounded to 2 decimal places? Question 9 Type numbers in the boxes Given the following summary statistics, determine the regression equation used to predict y from a. Part 1: 10 punts Part 2: 10 points Question 9 Type numbers in the boxes. Given the following summary statistics, determine the regression equation used to predict y from . Purt : 10 points Part 2: 10 points By 1.65 20 points 8 2.17 T 0.11 21.29 9 | 76.17 Round all answers to 2 decimal places. slope y-intercept Use the exact value of slope when calculating the y-intercept. Question 10 You are studying the effects of smoking by pregnant women on rates of asthma Type numbers in the boxes in their children. You collect data on the number of cigarettes smoked per day Part 1 10 point and whether or not the child developed asthma by the age of two. The data is Part 2: 10 points below: 20 points Smoked 1-5 cigarettes per day --- 8.5% developed asthma Smoked 6-10 cigarettes per day --- 9.8% developed asthma Smoked 11-20 cigarettes per day --- 25% developed asthma Smoked 21-40 cigarettes per day --- 35% developed asthma Smoked 41-60 cigarettes per day --- 37.8% developed asthma In order to study the relationship between the number of cigarettes smoked by pregnant women per day and the percentage of their children developed asthma by the age of two using statistical knowledge, we convert the above data into the following format and see if we can obtain an adequate fit using linear regression. Average number of cigarettes smoked per day 3 8 15.5 30.5 50.5 Percentage of children developed asthma 8.5% 9.8% 25% 35% 37.8% What is the value of the correlation coefficient? (Round your answer to 4 decimal places.) Assume that the best-fit line of the above data set is a good model for the study. For expectant mothers who smoke 35 cigarettes per day, what is the expected percentage of children who will develop asthma by the age of two. percent (Round your answer to 1 decimal place.) Question 7 Consider the following table summarizing the speed limit of a certain road and Type numbers in the boxes. the number of accidents occurring on that road in January. by Part 1:10 points by Part 2: 10 points Posted Speed Limit 55 49 44 39 22 Part 3: 10 points 30 points Reported Number of Accidents 28 27 21 15 17 14 20 1) Find the slope of the regression line predicting the number of accidents from the posted speed limit.Round to 3 decimal places. 2) Find the intercept of the regression line predicting the number of accidents from the posted speed limit. Round to 3 decimal places. 3) Predict the number of reported accidents for a posted speed limit of 27mph. Round to the nearest whole number. Question 8 Question 8 Type numbers in the boxes Consider the following: Part 1:10 points X 48 62 82 96 110 7 Part 2: 10 points B7 Part 3:10 points 30 points Y 219 220 180 126 102 1) What is slope of the regression line predicting Y from X,rounded to 2 decimal places? 2) What is the intercept of the regression line predicting Y from X, rounded to a decimal places? 3) What is the correlation between X and Y, rounded to 2 decimal places? Question 9 Type numbers in the boxes Given the following summary statistics, determine the regression equation used to predict y from a. Part 1: 10 punts Part 2: 10 points Question 9 Type numbers in the boxes. Given the following summary statistics, determine the regression equation used to predict y from . Purt : 10 points Part 2: 10 points By 1.65 20 points 8 2.17 T 0.11 21.29 9 | 76.17 Round all answers to 2 decimal places. slope y-intercept Use the exact value of slope when calculating the y-intercept. Question 10