

Question
You are the CFO of FALU, a premier investment firm. One of your high-net-worth clients wants to diversify her portfolio into the defensive sector by
You are the CFO of FALU, a premier investment firm. One of your high-net-worth clients wants to diversify her portfolio into the defensive sector by investing $20 million in either Loblaw Companies Limited (ticker: L) or Metro Inc. (ticker: MRU). The client wants to invest in only one of the 2 companies but not both. You are required to perform comprehensive analyses of the two companies and make a recommendation for the client to invest in one of them based on your analyses.
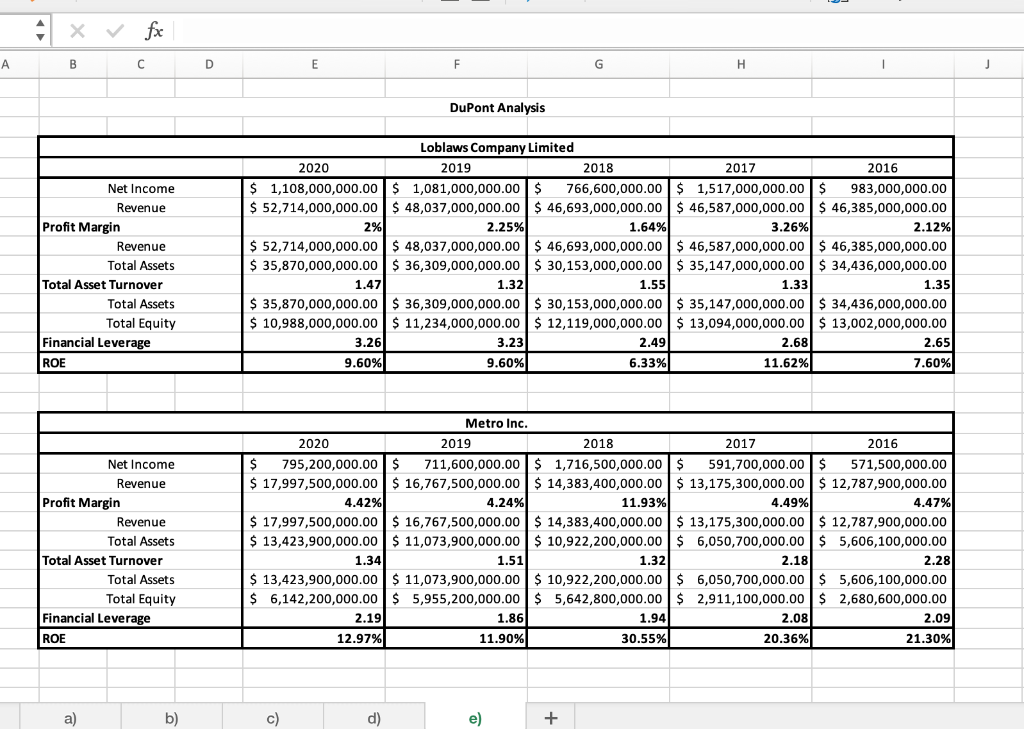
1. Create a Financial analysis analyze and discuss the ratios of the companies highlighting the company with better performance based on your analysis. You can create subsections for the 4 ratio categories plus the DuPont analysis. You should include summarized tables or charts (with values) of the ratios over the 5 years.
X fx A B D E F G H DuPont Analysis 2018 Net Income Revenue Profit Margin Revenue Total Assets Total Asset Turnover Total Assets Total Equity Financial Leverage ROE Loblaws Company Limited 2020 2019 2017 2016 $ 1,108,000,000.00 $ 1,081,000,000.00 $ 766,600,000.00 $ 1,517,000,000.00 $ 983,000,000.00 $ 52,714,000,000.00 $ 48,037,000,000.00 $ 46,693,000,000.00 $ 46,587,000,000.00 $ 46,385,000,000.00 2% 2.25% 1.64% 3.26% 2.12% $ 52,714,000,000.00 $ 48,037,000,000.00 $ 46,693,000,000.00 $ 46,587,000,000.00 $ 46,385,000,000.00 $ 35,870,000,000.00 $ 36,309,000,000.00 $ 30,153,000,000.00 $ 35,147,000,000.00 $ 34,436,000,000.00 1.47 1.32 1.55 1.33 1.35 $ 35,870,000,000.00 $ 36,309,000,000.00 $ 30,153,000,000.00 $ 35,147,000,000.00 $ 34,436,000,000.00 $ 10,988,000,000.00 $ 11,234,000,000.00 $ 12,119,000,000.00 $ 13,094,000,000.00 $ 13,002,000,000.00 3.26 3.23 2.49 2.68 2.65 9.60% 9.60% 6.33% 11.62% 7.60% Net Income Revenue Profit Margin Revenue Total Assets Total Asset Turnover Total Assets Total Equity Financial Leverage ROE Metro Inc. 2020 2019 2018 2017 2016 $ 795,200,000.00 $ 711,600,000.00 $ 1,716,500,000.00 $ 591,700,000.00 $ 571,500,000.00 $ 17,997,500,000.00 $ 16,767,500,000.00 $ 14,383,400,000.00 $ 13,175,300,000.00 $ 12,787,900,000.00 4.42% 4.24% 11.93% 4.49% 4.47% $ 17,997,500,000.00 $ 16,767,500,000.00 $ 14,383,400,000.00 $ 13,175,300,000.00 $ 12,787,900,000.00 $ 13,423,900,000.00 $ 11,073,900,000.00 $ 10,922,200,000.00 $ 6,050,700,000.00 $ 5,606,100,000.00 1.34 1.51 1.32 2.18 2.28 $ 13,423,900,000.00 $ 11,073,900,000.00 $ 10,922,200,000.00 $ 6,050,700,000.00 $ 5,606,100,000.00 $ 6,142,200,000.00 $ 5,955,200,000.00 $ 5,642,800,000.00 $ 2,911,100,000.00 $ 2,680,600,000.00 2.19 1.86 1.94 2.08 2.09 12.97% 11.90% 30.55% % 20.36% 21.30% a) b) c) d) + X fx A B D E F G H DuPont Analysis 2018 Net Income Revenue Profit Margin Revenue Total Assets Total Asset Turnover Total Assets Total Equity Financial Leverage ROE Loblaws Company Limited 2020 2019 2017 2016 $ 1,108,000,000.00 $ 1,081,000,000.00 $ 766,600,000.00 $ 1,517,000,000.00 $ 983,000,000.00 $ 52,714,000,000.00 $ 48,037,000,000.00 $ 46,693,000,000.00 $ 46,587,000,000.00 $ 46,385,000,000.00 2% 2.25% 1.64% 3.26% 2.12% $ 52,714,000,000.00 $ 48,037,000,000.00 $ 46,693,000,000.00 $ 46,587,000,000.00 $ 46,385,000,000.00 $ 35,870,000,000.00 $ 36,309,000,000.00 $ 30,153,000,000.00 $ 35,147,000,000.00 $ 34,436,000,000.00 1.47 1.32 1.55 1.33 1.35 $ 35,870,000,000.00 $ 36,309,000,000.00 $ 30,153,000,000.00 $ 35,147,000,000.00 $ 34,436,000,000.00 $ 10,988,000,000.00 $ 11,234,000,000.00 $ 12,119,000,000.00 $ 13,094,000,000.00 $ 13,002,000,000.00 3.26 3.23 2.49 2.68 2.65 9.60% 9.60% 6.33% 11.62% 7.60% Net Income Revenue Profit Margin Revenue Total Assets Total Asset Turnover Total Assets Total Equity Financial Leverage ROE Metro Inc. 2020 2019 2018 2017 2016 $ 795,200,000.00 $ 711,600,000.00 $ 1,716,500,000.00 $ 591,700,000.00 $ 571,500,000.00 $ 17,997,500,000.00 $ 16,767,500,000.00 $ 14,383,400,000.00 $ 13,175,300,000.00 $ 12,787,900,000.00 4.42% 4.24% 11.93% 4.49% 4.47% $ 17,997,500,000.00 $ 16,767,500,000.00 $ 14,383,400,000.00 $ 13,175,300,000.00 $ 12,787,900,000.00 $ 13,423,900,000.00 $ 11,073,900,000.00 $ 10,922,200,000.00 $ 6,050,700,000.00 $ 5,606,100,000.00 1.34 1.51 1.32 2.18 2.28 $ 13,423,900,000.00 $ 11,073,900,000.00 $ 10,922,200,000.00 $ 6,050,700,000.00 $ 5,606,100,000.00 $ 6,142,200,000.00 $ 5,955,200,000.00 $ 5,642,800,000.00 $ 2,911,100,000.00 $ 2,680,600,000.00 2.19 1.86 1.94 2.08 2.09 12.97% 11.90% 30.55% % 20.36% 21.30% a) b) c) d) +Step by Step Solution
There are 3 Steps involved in it
Step: 1

Get Instant Access to Expert-Tailored Solutions
See step-by-step solutions with expert insights and AI powered tools for academic success
Step: 2

Step: 3
Ace Your Homework with AI
Get the answers you need in no time with our AI-driven, step-by-step assistance
Get Started
The School Fundraising Handbook
Authors: Lindsey Marsh
1st Edition
1785834266, 978-1785834264