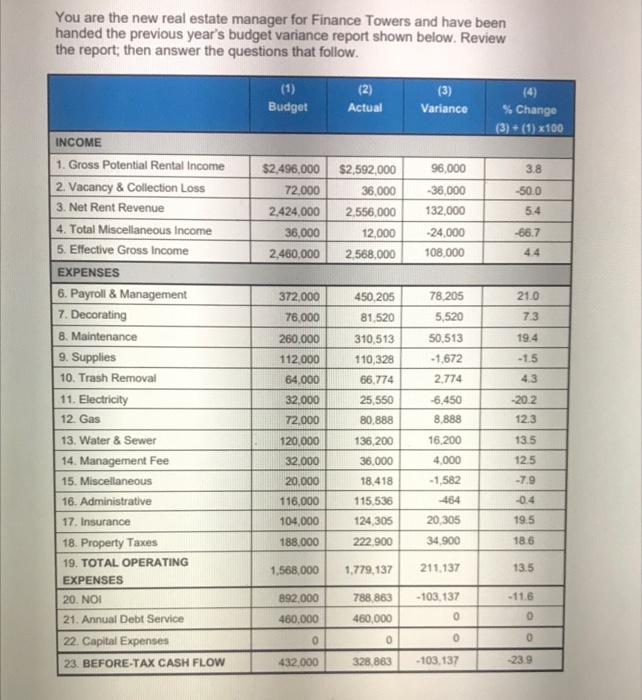
You are the new real estate manager for Finance Towers and have been handed the previous year's budget variance report shown below. Review the report then answer the questions that follow. (2) Actual Budget (3) Variance % Change (3) + (1) x100 INCOME 3.8 $2,496,000 72.000 2.424.000 36,000 2,460,000 -50.0 $2,592,000 36.000 2,556,000 12,000 2.568,000 96,000 -36.000 132,000 5.4 -24.000 -66.7 4.4 108.000 372.000 21.0 450,205 81.520 78 205 5,520 76,000 73 260.000 310,513 19.4 -1.5 112 000 110,328 1. Gross Potential Rental Income 2. Vacancy & Collection Loss 3. Net Rent Revenue 4. Total Miscellaneous Income 5. Effective Gross Income EXPENSES 6. Payroll & Management 7. Decorating 8. Maintenance 9. Supplies 10. Trash Removal 11. Electricity 12. Gas 13. Water & Sewer 14. Management Fee 15. Miscellaneous 16. Administrative 17. Insurance 18. Property Taxes 19. TOTAL OPERATING EXPENSES 20. NOI 64.000 66.774 43 32.000 25,550 80.888 -20.2 123 72.000 120,000 32.000 13.5 50,513 -1,672 2.774 -6,450 8.888 16.200 4.000 - 1,582 -464 20,305 34 900 125 136,200 36.000 18.418 115.536 124 305 20,000 -7.9 116,000 -0.4 104,000 188.000 19.5 186 222.900 1,568,000 1.779,137 211.137 13.5 892.000 788.863 - 103.137 0 - 11.6 0 21. Annual Debt Service 460,000 460,000 0 0 0 0 22. Capital Expenses 23. BEFORE-TAX CASH FLOW 432.000 328 863 -103.137 23.9 1. What are the most significant variances? 2. What factors may have caused these variances? 3. What steps might you take to verify whether the variance was an operational shortcoming, or the result of a poor budgeting process? 4. What would you do to correct your variances? 5. How will you explain the budget projections for next year? You are the new real estate manager for Finance Towers and have been handed the previous year's budget variance report shown below. Review the report then answer the questions that follow. (2) Actual Budget (3) Variance % Change (3) + (1) x100 INCOME 3.8 $2,496,000 72.000 2.424.000 36,000 2,460,000 -50.0 $2,592,000 36.000 2,556,000 12,000 2.568,000 96,000 -36.000 132,000 5.4 -24.000 -66.7 4.4 108.000 372.000 21.0 450,205 81.520 78 205 5,520 76,000 73 260.000 310,513 19.4 -1.5 112 000 110,328 1. Gross Potential Rental Income 2. Vacancy & Collection Loss 3. Net Rent Revenue 4. Total Miscellaneous Income 5. Effective Gross Income EXPENSES 6. Payroll & Management 7. Decorating 8. Maintenance 9. Supplies 10. Trash Removal 11. Electricity 12. Gas 13. Water & Sewer 14. Management Fee 15. Miscellaneous 16. Administrative 17. Insurance 18. Property Taxes 19. TOTAL OPERATING EXPENSES 20. NOI 64.000 66.774 43 32.000 25,550 80.888 -20.2 123 72.000 120,000 32.000 13.5 50,513 -1,672 2.774 -6,450 8.888 16.200 4.000 - 1,582 -464 20,305 34 900 125 136,200 36.000 18.418 115.536 124 305 20,000 -7.9 116,000 -0.4 104,000 188.000 19.5 186 222.900 1,568,000 1.779,137 211.137 13.5 892.000 788.863 - 103.137 0 - 11.6 0 21. Annual Debt Service 460,000 460,000 0 0 0 0 22. Capital Expenses 23. BEFORE-TAX CASH FLOW 432.000 328 863 -103.137 23.9 1. What are the most significant variances? 2. What factors may have caused these variances? 3. What steps might you take to verify whether the variance was an operational shortcoming, or the result of a poor budgeting process? 4. What would you do to correct your variances? 5. How will you explain the budget projections for next year