Answered step by step
Verified Expert Solution
Link Copied!

Question

1 Approved Answer

You are working as a revenue cycle manager at a hospital in your local area. Your hospital seems nearly 20,000 patients per year. You are

You are working as a revenue cycle manager at a hospital in your local area. Your hospital seems nearly 20,000 patients per year. You are interested in knowing how well your hospital is doing in terms of collecting The table shown in the attached CSV file

Download attached CSV file is for 100 patients at your healthcare facility. The table simply codes each patient as 1 or 0. If the patient has paid most of his/her bill to your facility, he/she is coded as 1. Otherwise, the patient is coded as 0.

As a revenue cycle manager, you would like to see this ratio be near 90%. Determine whether the data in the table is meeting the rate of 90% if your management is willing to accept a 5% chance of making the incorrect decision. Use the spreadsheet referenced above to complete your work for this part.
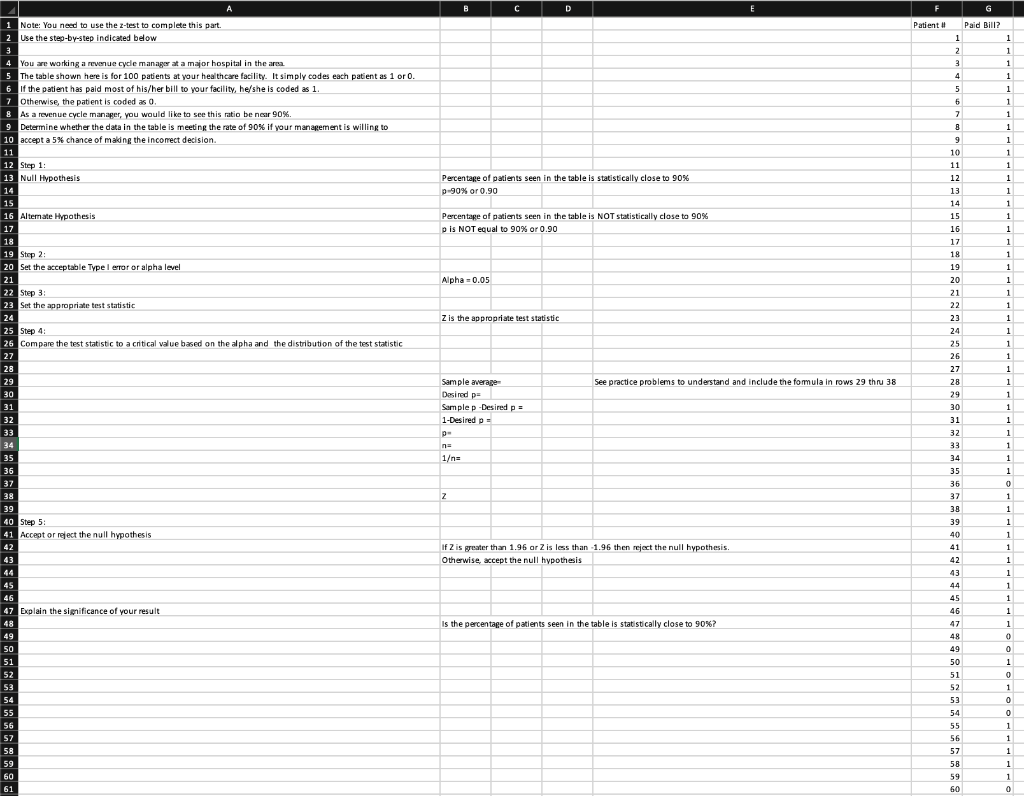

image text in transcribed

image text in transcribed

A C D E 1 Note: You nead to use the z-test to complete this part. Patient \# Paid Bill? Use the stey-by-step indicated below You are working a revenue cycle managcr at a major hospital in the area. The table shown here is for 100 patients at vour healtheare facility. It simply codes each patient as 1 or 0. If the patient has paid most of his/her bill to your facility, he/she is coded as 1. Otherwise, the patient is coded as 0 . As a rovenue cycle manager, you would like to see this matio be near 90%. Determine whether the data in the table is meeting the rate of 90% if your management is willing to accept a 5% chance of making the inco rect decision. Step 1: Null Hypothesis Perentage of patients seen in the table is statistically close to 90% Altemate Hpothesis Percentage of patients seen in the table is NOT statistically close to 90% p is NOT equal to 90% or 0.90 Strp 2: Set the acceptable Type I error or alpha level Step 3: Sct the appropriate test statistic 5 tep 4: Compare the test statistic to a critical value based on the al pha and the distribution of the test statistic Step 5 : Accegt or reject the null hypothesis If Z is greater than 1.96 ar Z is less than -1.96 then reject the null hypothesis. Otherwise, accept the null hypothesis Explain the sianificance of your result Is the percentage of patients seen in the table is statistically close to 90%

Step by Step Solution

There are 3 Steps involved in it

Step: 1

blur-text-image

Get Instant Access to Expert-Tailored Solutions

See step-by-step solutions with expert insights and AI powered tools for academic success

Step: 2

blur-text-image

Step: 3

blur-text-image

Ace Your Homework with AI

Get the answers you need in no time with our AI-driven, step-by-step assistance

Get Started

Recommended Textbook for

Operations Management For Competitive Advantage

Authors: Richard B. Chase, F. Robert Jacobs

11th Edition

72983906, 71115528, 9780071115520, 978-0072983913

More Books

Students also viewed these General Management questions