Answered step by step
Verified Expert Solution
Question
1 Approved Answer
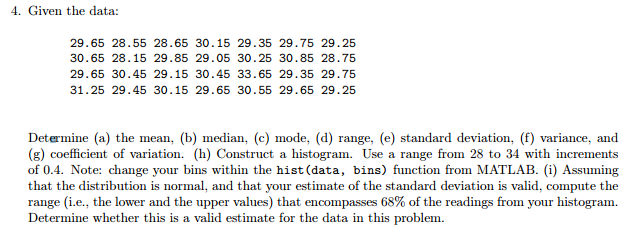
you can use matlab to solve this problem. Given the data: Determine (a) the mean, (b) median, (c) mode, (d) range, (e) standard deviation, (f)


you can use matlab to solve this problem.
Given the data: Determine (a) the mean, (b) median, (c) mode, (d) range, (e) standard deviation, (f) variance, and (g) coefficient of variation, (h) Construct a histogram. Use a range from 28 to 34 with increments of 0.4. Note: change your bins within the hist (data, bins) function from MATLAB. (i) Assuming that the distribution Ls normal, and that your estimate of the standard deviation is valid, compute the range (i.e., the lower and the upper values) that encompasses 68% of the readings from your histogram. Determine whether this is a valid estimate for the data in this problem. Extra Credit: For problem 4. develop an M-file function to compute descriptive statistics for a vector of values. Have the function determine and display number of values, mean, median, mode, range, standard deviation, variance, and coefficient of variation. In addition, have it generate a histogram. Given the data: Determine (a) the mean, (b) median, (c) mode, (d) range, (e) standard deviation, (f) variance, and (g) coefficient of variation, (h) Construct a histogram. Use a range from 28 to 34 with increments of 0.4. Note: change your bins within the hist (data, bins) function from MATLAB. (i) Assuming that the distribution Ls normal, and that your estimate of the standard deviation is valid, compute the range (i.e., the lower and the upper values) that encompasses 68% of the readings from your histogram. Determine whether this is a valid estimate for the data in this problem. Extra Credit: For problem 4. develop an M-file function to compute descriptive statistics for a vector of values. Have the function determine and display number of values, mean, median, mode, range, standard deviation, variance, and coefficient of variation. In addition, have it generate a histogramStep by Step Solution
There are 3 Steps involved in it
Step: 1

Get Instant Access to Expert-Tailored Solutions
See step-by-step solutions with expert insights and AI powered tools for academic success
Step: 2

Step: 3

Ace Your Homework with AI
Get the answers you need in no time with our AI-driven, step-by-step assistance
Get Started


