

Answered step by step
Verified Expert Solution
Question
1 Approved Answer
You contact the jumpers used to generate the data in the table below and measure their frontal areas. m, kg 721 83.6 53.4 My m/s
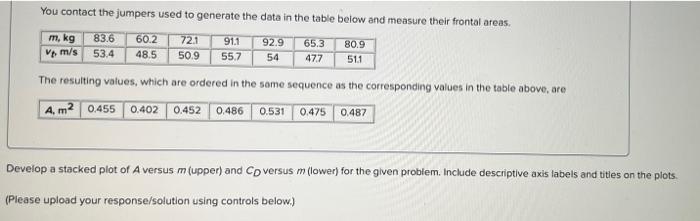 You contact the jumpers used to generate the data in the table below and measure their frontal areas. m, kg 721 83.6 53.4 My m/s 60.2 48.5 92.9 91.1 55.7 50.9 65.3 47.7 80.9 511 54 The resulting values, which are ordered in the same sequence as the corresponding values in the table above, are A. m 0.455 0.402 0.452 0.486 0.531 0.475 0.487 Develop a stacked plot of A versus m (upper) and Co versus m (lower) for the given problem. Include descriptive axis labels and titles on the plots. (Please upload your response/solution using controls below.)
Step by Step Solution
There are 3 Steps involved in it
Step: 1

Get Instant Access to Expert-Tailored Solutions
See step-by-step solutions with expert insights and AI powered tools for academic success
Step: 2

Step: 3
Ace Your Homework with AI
Get the answers you need in no time with our AI-driven, step-by-step assistance
Get Started
Project Management A Managerial Approach
Authors: Jack R. Meredith, Samuel J. Mantel,
7th Edition
470226218, 978-0470226216