

Answered step by step
Verified Expert Solution
Question
1 Approved Answer
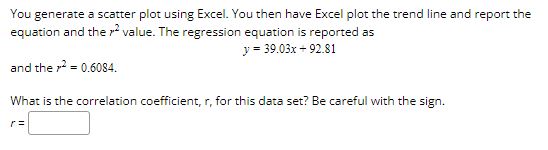
You generate a scatter plot using Excel. You then have Excel plot the trend line and report the equaon and the :3 'u'EllUE. The regression
Step by Step Solution
There are 3 Steps involved in it
Step: 1

Get Instant Access to Expert-Tailored Solutions
See step-by-step solutions with expert insights and AI powered tools for academic success
Step: 2

Step: 3
Ace Your Homework with AI
Get the answers you need in no time with our AI-driven, step-by-step assistance
Get Started
Elementary Linear Algebra with Applications
Authors: Bernard Kolman, David Hill
9th edition
132296543, 978-0132296540