Question
You have been asked to evaluate the two production processes and present your findings to the board of directors. Your CEO Charlie learned capital budgeting


You have been asked to evaluate the two production processes and present your findings to the board of directors. Your CEO Charlie learned capital budgeting techniques in his
finance classes. You are confident that she is able to distinguish among competing investment decision rules and use the appropriate criteria for decision-making. However, the founder and Chairman of the Board, Lawrence Rollins, has never been to business school. He prefers the second process because it costs less money up-front. Besides, several influential old-timers on the board are intrigued by the payback decision rule, which you believe contains significant shortcomings. Your job is to clearly articulate the relative merits of each investment decision criterion.
Your report should contain answers to the following questions:
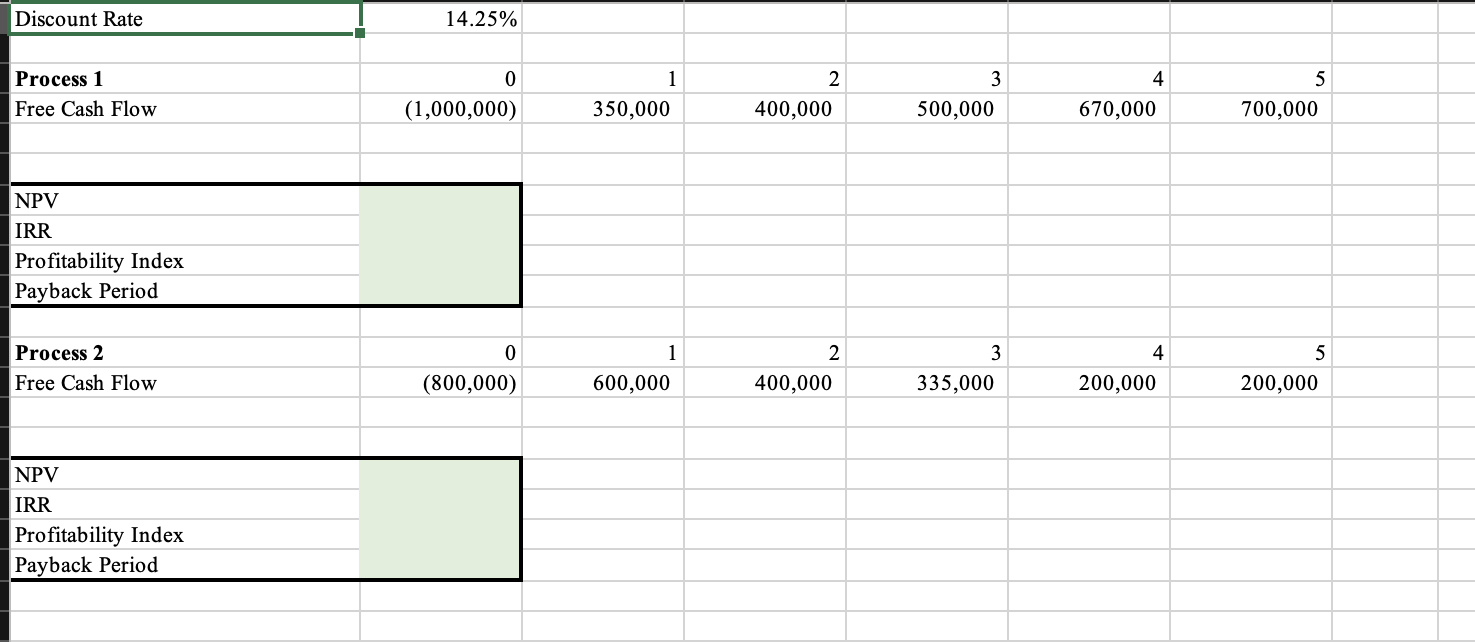
Compute the Net Present Value (NPV), Internal Rate of Return (IRR), Profitability Index, and Payback Period for each process. You can use the Excel template (Extra_Credit_Template.xlsx) to complete the calculations.
Based on your calculations, will you recommend Process 1 or Process 2?
Explain why the payback period, IRR, and Profitability Index are not appropriate decision rules in this case.
How would you convince the board that the NPV method is the best decision rule?
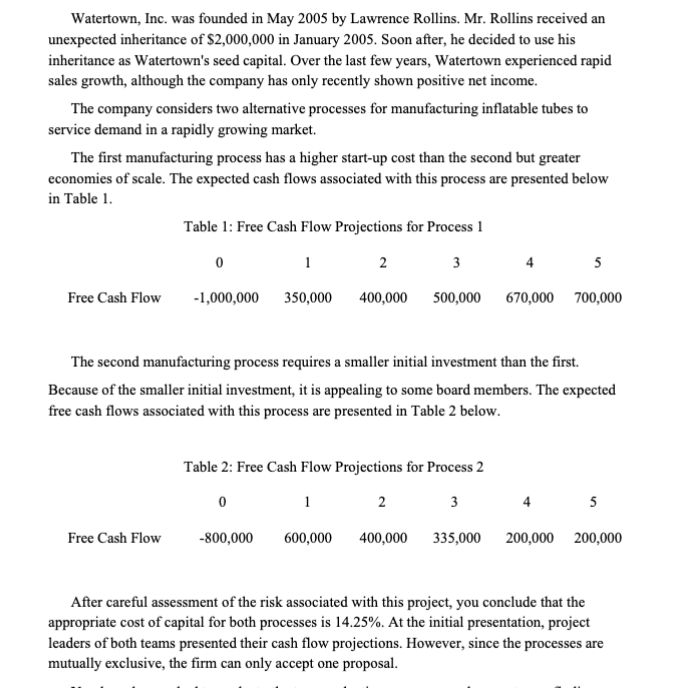
Watertown, Inc. was founded in May 2005 by Lawrence Rollins. Mr. Rollins received an unexpected inheritance of $2,000,000 in January 2005 . Soon after, he decided to use his inheritance as Watertown's seed capital. Over the last few years, Watertown experienced rapid sales growth, although the company has only recently shown positive net income. The company considers two alternative processes for manufacturing inflatable tubes to service demand in a rapidly growing market. The first manufacturing process has a higher start-up cost than the second but greater economies of scale. The expected cash flows associated with this process are presented below in Table 1. Table 1: Free Cash Flow Projections for Process 1 The second manufacturing process requires a smaller initial investment than the first. Because of the smaller initial investment, it is appealing to some board members. The expected free cash flows associated with this process are presented in Table 2 below. Table 2: Free Cash Flow Projections for Process 2 After careful assessment of the risk associated with this project, you conclude that the appropriate cost of capital for both processes is 14.25%. At the initial presentation, project leaders of both teams presented their cash flow projections. However, since the processes are mutually exclusive, the firm can only accept one proposal. Discount Rate 14.25% Process 1 Free Cash Flow \begin{tabular}{|r|r|r|r|r|r|} \hline 0 & 1 & 2 & 3 & 4 & 5 \\ \hline(1,000,000) & 350,000 & 400,000 & 500,000 & 670,000 & 700,000 \\ \hline \end{tabular} NPV IRR Profitability Index Payback Period Process 2 Free Cash Flow \begin{tabular}{|r|r|r|r|r|r|} \hline 0 & 1 & 2 & 3 & 4 & 5 \\ \hline(800,000) & 600,000 & 400,000 & 335,000 & 200,000 & 200,000 \\ \hline \end{tabular} NPV IRR Profitability Index Payback Period Watertown, Inc. was founded in May 2005 by Lawrence Rollins. Mr. Rollins received an unexpected inheritance of $2,000,000 in January 2005 . Soon after, he decided to use his inheritance as Watertown's seed capital. Over the last few years, Watertown experienced rapid sales growth, although the company has only recently shown positive net income. The company considers two alternative processes for manufacturing inflatable tubes to service demand in a rapidly growing market. The first manufacturing process has a higher start-up cost than the second but greater economies of scale. The expected cash flows associated with this process are presented below in Table 1. Table 1: Free Cash Flow Projections for Process 1 The second manufacturing process requires a smaller initial investment than the first. Because of the smaller initial investment, it is appealing to some board members. The expected free cash flows associated with this process are presented in Table 2 below. Table 2: Free Cash Flow Projections for Process 2 After careful assessment of the risk associated with this project, you conclude that the appropriate cost of capital for both processes is 14.25%. At the initial presentation, project leaders of both teams presented their cash flow projections. However, since the processes are mutually exclusive, the firm can only accept one proposal. Discount Rate 14.25% Process 1 Free Cash Flow \begin{tabular}{|r|r|r|r|r|r|} \hline 0 & 1 & 2 & 3 & 4 & 5 \\ \hline(1,000,000) & 350,000 & 400,000 & 500,000 & 670,000 & 700,000 \\ \hline \end{tabular} NPV IRR Profitability Index Payback Period Process 2 Free Cash Flow \begin{tabular}{|r|r|r|r|r|r|} \hline 0 & 1 & 2 & 3 & 4 & 5 \\ \hline(800,000) & 600,000 & 400,000 & 335,000 & 200,000 & 200,000 \\ \hline \end{tabular} NPV IRR Profitability Index Payback PeriodStep by Step Solution
There are 3 Steps involved in it
Step: 1

Get Instant Access to Expert-Tailored Solutions
See step-by-step solutions with expert insights and AI powered tools for academic success
Step: 2

Step: 3

Ace Your Homework with AI
Get the answers you need in no time with our AI-driven, step-by-step assistance
Get Started


