Answered step by step
Verified Expert Solution
Question
1 Approved Answer
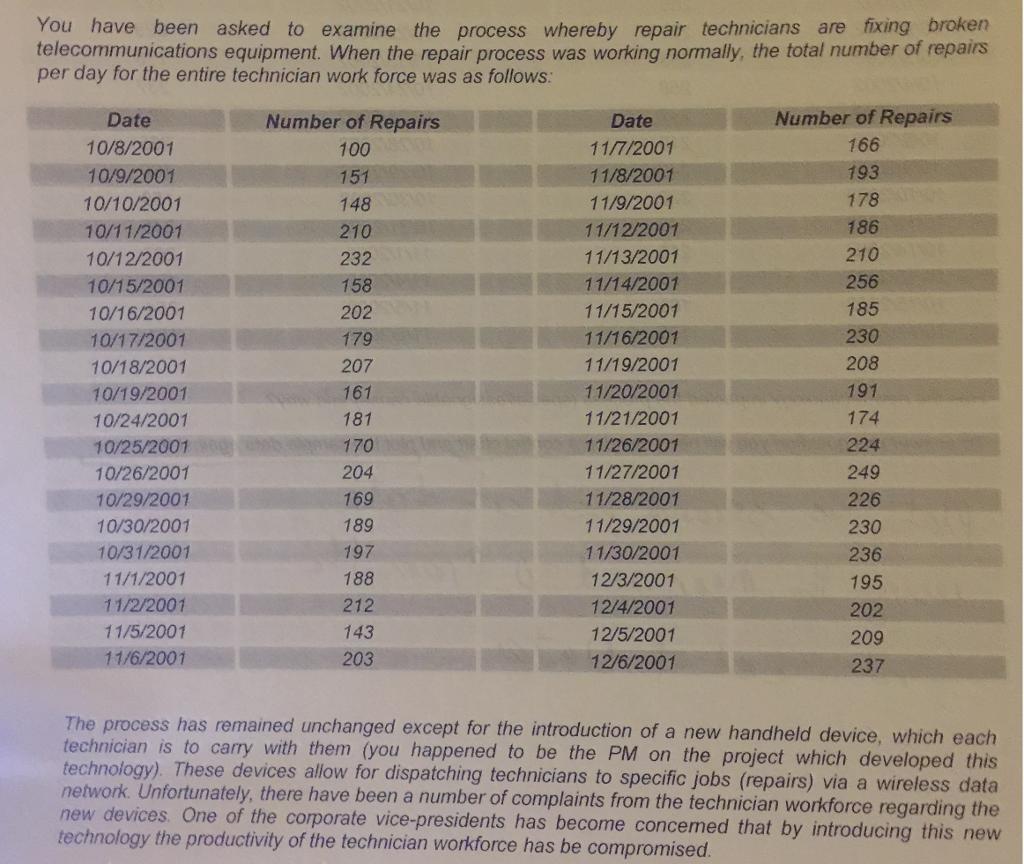
You have been asked to examine the process whereby repair technicians are fixing broken telecommunications equipment. When the repair process was working normally, the


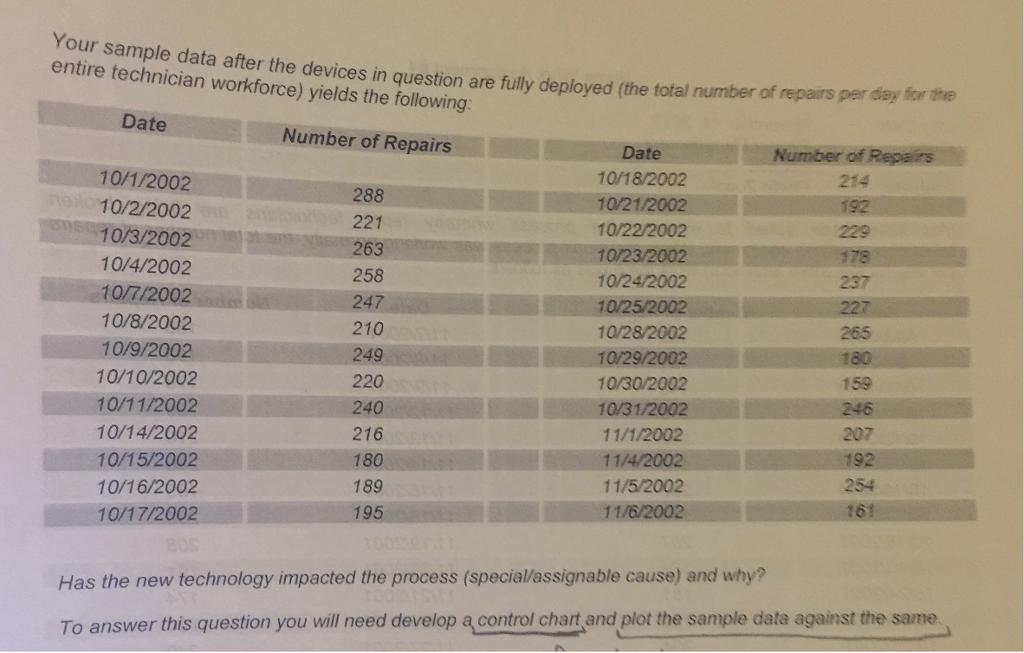
You have been asked to examine the process whereby repair technicians are fixing broken telecommunications equipment. When the repair process was working normally, the total number of repairs per day for the entire technician work force was as follows: Date 10/8/2001 10/9/2001 10/10/2001 10/11/2001 10/12/2001 10/15/2001 10/16/2001 10/17/2001 10/18/2001 10/19/2001 10/24/2001 10/25/2001 10/26/2001 10/29/2001 10/30/2001 10/31/2001 11/1/2001 11/2/2001 11/5/2001 11/6/2001 Number of Repairs 100 151 148 210 232 158 202 179 207 161 181 170 204 169 189 197 188 212 143 203 Date 11/7/2001 11/8/2001 11/9/2001 11/12/2001 11/13/2001 11/14/2001 11/15/2001 11/16/2001 11/19/2001 11/20/2001 11/21/2001 11/26/2001 11/27/2001 11/28/2001 11/29/2001 11/30/2001 12/3/2001 12/4/2001 12/5/2001 12/6/2001 Number of Repairs 166 193 178 186 210 256 185 230 208 191 174 224 249 226 230 236 195 202 209 237 The process has remained unchanged except for the introduction of a new handheld device, which each technician is to carry with them (you happened to be the PM on the project which developed this technology). These devices allow for dispatching technicians to specific jobs (repairs) via a wireless data network. Unfortunately, there have been a number of complaints from the technician workforce regarding the new devices. One of the corporate vice-presidents has become concemed that by introducing this new technology the productivity of the technician workforce has be compromised. Your sample data after the devices in question are fully deployed (the total number of repairs per day for the entire technician workforce) yields the following: Number of Repairs Date 10/1/2002 288 221 101 at 263 258 247 210 249 220 240 216 180 CHR 1891 hello 10/2/20022mbel BB10/3/2002 10/4/2002 10/7/2002 10/8/2002 10/9/2002 10/10/2002 10/11/2002 10/14/2002 10/15/2002 10/16/2002 10/17/2002 195 Date 10/18/2002 10/21/2002 10/22/2002 10/23/2002 10/24/2002 10/25/2002 10/28/2002 10/29/2002 10/30/2002 10/31/2002 11/1/2002 11/4/2002 11/5/2002 11/6/2002 Number of Repairs 214 192 229 178 237 227 265 180 159 246 207 192 254 Has the new technology impacted the process (special/assignable cause) and why? To answer this question you will need develop a control chart and plot the sample data against the same.
Step by Step Solution
★★★★★
3.44 Rating (154 Votes )
There are 3 Steps involved in it
Step: 1
Original data Date No of repiars Mean UCL LCL 1 100 194725 2898411 9960891 2 151 194725 2898411 9960891 3 148 194725 2898411 9960891 4 210 194725 2898...
Get Instant Access to Expert-Tailored Solutions
See step-by-step solutions with expert insights and AI powered tools for academic success
Step: 2

Step: 3

Ace Your Homework with AI
Get the answers you need in no time with our AI-driven, step-by-step assistance
Get Started


