Answered step by step
Verified Expert Solution
Link Copied!

Question

1 Approved Answer

You have been assigned the task of comparing the investment performance of five different investment managers. After gathering 60 months of excess returns (i.e. returns
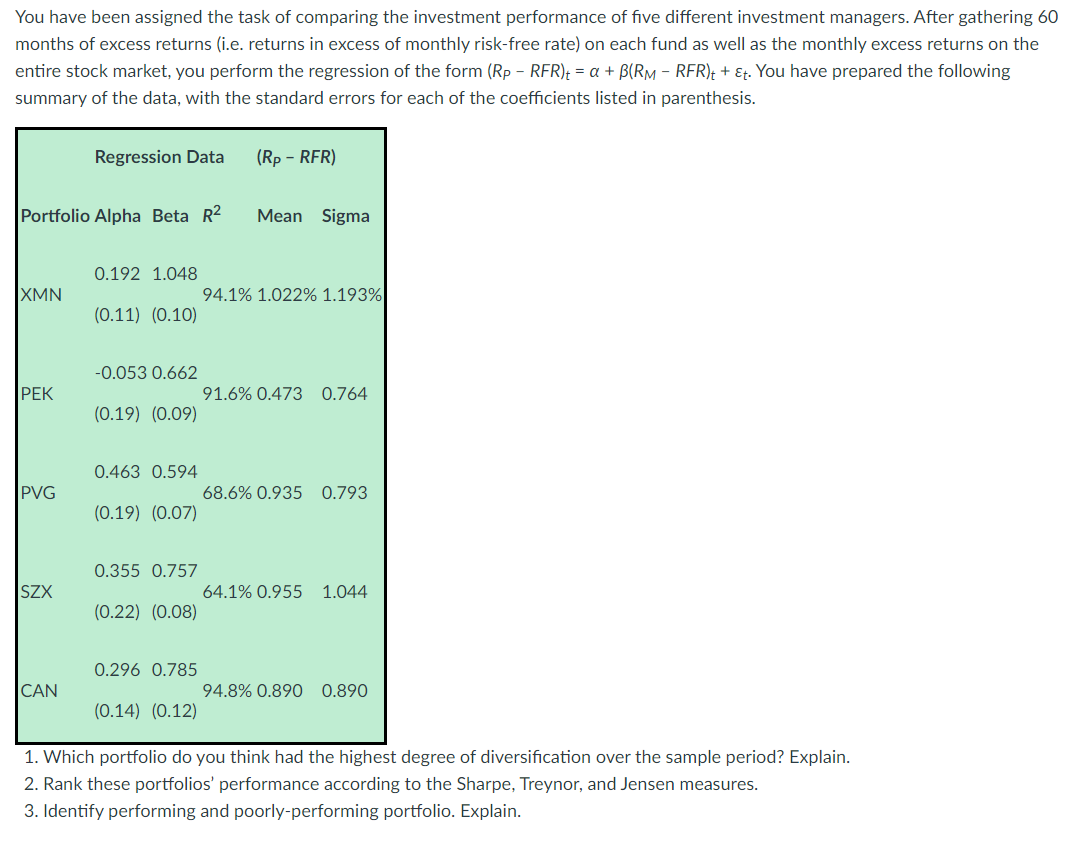
image text in transcribed

You have been assigned the task of comparing the investment performance of five different investment managers. After gathering 60 months of excess returns (i.e. returns in excess of monthly risk-free rate) on each fund as well as the monthly excess returns on the entire stock market, you perform the regression of the form (Rp - RFR)t = a + B(RM -RFR); + &t. You have prepared the following summary of the data, with the standard errors for each of the coefficients listed in parenthesis. Regression Data (Rp - RFR) Portfolio Alpha Beta R2 Mean Sigma XMN 0.192 1.048 94.1% 1.022% 1.193% (0.11) (0.10) -0.053 0.662 91.6% 0.473 0.764 (0.19) (0.09) PVG 0.463 0.594 68.6% 0.935 (0.19) (0.07) 0.793 SZX 0.355 0.757 64.1% 0.955 (0.22) (0.08) 1.044 CAN 0.296 0.785 94.8% 0.890 0.890 (0.14) (0.12) 1. Which portfolio do you think had the highest degree of diversification over the sample period? Explain. 2. Rank these portfolios' performance according to the Sharpe, Treynor, and Jensen measures. 3. Identify performing and poorly-performing portfolio. Explain. You have been assigned the task of comparing the investment performance of five different investment managers. After gathering 60 months of excess returns (i.e. returns in excess of monthly risk-free rate) on each fund as well as the monthly excess returns on the entire stock market, you perform the regression of the form (Rp - RFR)t = a + B(RM -RFR); + &t. You have prepared the following summary of the data, with the standard errors for each of the coefficients listed in parenthesis. Regression Data (Rp - RFR) Portfolio Alpha Beta R2 Mean Sigma XMN 0.192 1.048 94.1% 1.022% 1.193% (0.11) (0.10) -0.053 0.662 91.6% 0.473 0.764 (0.19) (0.09) PVG 0.463 0.594 68.6% 0.935 (0.19) (0.07) 0.793 SZX 0.355 0.757 64.1% 0.955 (0.22) (0.08) 1.044 CAN 0.296 0.785 94.8% 0.890 0.890 (0.14) (0.12) 1. Which portfolio do you think had the highest degree of diversification over the sample period? Explain. 2. Rank these portfolios' performance according to the Sharpe, Treynor, and Jensen measures. 3. Identify performing and poorly-performing portfolio. Explain

Step by Step Solution

There are 3 Steps involved in it

Step: 1

blur-text-image

Get Instant Access to Expert-Tailored Solutions

See step-by-step solutions with expert insights and AI powered tools for academic success

Step: 2

blur-text-image_2

Step: 3

blur-text-image_3

Ace Your Homework with AI

Get the answers you need in no time with our AI-driven, step-by-step assistance

Get Started

Recommended Textbook for

More Books

Students also viewed these Finance questions

Question

In which of the following environments can sound travel fastest?

Answered: 1 week ago

Question

Which type of energy does an object have when it is in motion?

Answered: 1 week ago

Question

The working principle of a washing machine is?

Answered: 1 week ago

Question

Nuclear sizes are expressed in a unit named?

Answered: 1 week ago