Answered step by step
Verified Expert Solution
Question
1 Approved Answer
You have been to investigate the following data for a large building services company a. Produce a histogram for each of the distribution scaled such
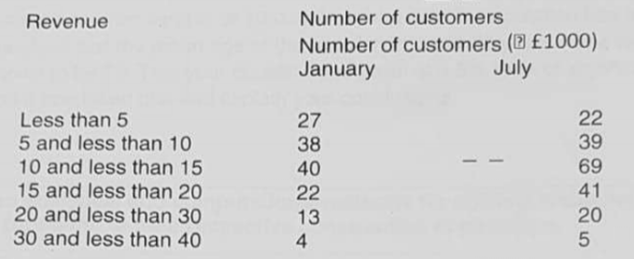
You have been to investigate the following data for a large building services company

a. Produce a histogram for each of the distribution scaled such that the area of each rectangle represents frequency density and find the mode.
b. Produce a cumulative frequency curve for each of the distribution and find the mediar inter quartile range.
- The mean
- The range
- The standard deviation
Revenue Less than 5 5 and less than 10 10 and less than 15 15 and less than 20 20 and less than 30 30 and less than 40 Number of customers Number of customers (1000) January July 27 38 40 22 13 4 22 39 69 41 20 5
Step by Step Solution
★★★★★
3.60 Rating (157 Votes )
There are 3 Steps involved in it
Step: 1
You have been asked to investigate the following data for a large building service company The gi...
Get Instant Access to Expert-Tailored Solutions
See step-by-step solutions with expert insights and AI powered tools for academic success
Step: 2

Step: 3

Ace Your Homework with AI
Get the answers you need in no time with our AI-driven, step-by-step assistance
Get Started


