

Question
You have just been hired as a financial analyst for Lydex Company, a manufacturer of safety helmets. Your boss has asked you to perform a
|
You have just been hired as a financial analyst for Lydex Company, a manufacturer of safety helmets. Your boss has asked you to perform a comprehensive analysis of the companys financial statements, including comparing Lydexs performance to its major competitors. The companys financial statements for the last two years are as follows: (Lydex Company Comparative Balance Sheet This YearLast Year Assets Current assets: Cash$1,020,000 $1,320,000 Marketable securities 0 300,000 Accounts receivable, net 2,940,000 2,040,000 Inventory 3,660,000 2,100,000 Prepaid expenses 270,000 210,000 Total current assets 7,890,000 5,970,000 Plant and equipment, net 9,640,000 9,110,000 Total assets$17,530,000 $15,080,000 Liabilities and Stockholders' Equity Liabilities: Current liabilities$4,070,000 $2,450,000 Note payable, 10% 3,700,000 3,100,000 Total liabilities 7,770,000 5,550,000 Stockholders' equity: Common stock, $75 par value 7,500,000 7,500,000 Retained earnings 2,260,000 2,030,000 Total stockholders' equity 9,760,000 9,530,000 Total liabilities and stockholders' equity$17,530,000 $15,080,000 ) Lydex Company Comparative Income Statement and Reconciliation This YearLast Year Sales (all on account)$15,920,000 $14,180,000 Cost of goods sold 12,736,000 10,635,000 Gross margin 3,184,000 3,545,000 Selling and administrative expenses 2,028,286 1,628,000 (Net operating income 1,155,714 1,917,000 Interest expense 370,000 310,000 Net income before taxes 785,714 1,607,000 Income taxes (30%) 235,714 482,100 Net income 550,000 1,124,900 Common dividends 320,000 562,450 Net income retained 230,000 562,450 Beginning retained earnings 2,030,000 1,467,550 Ending retained earnings$2,260,000 $2,030,000 )
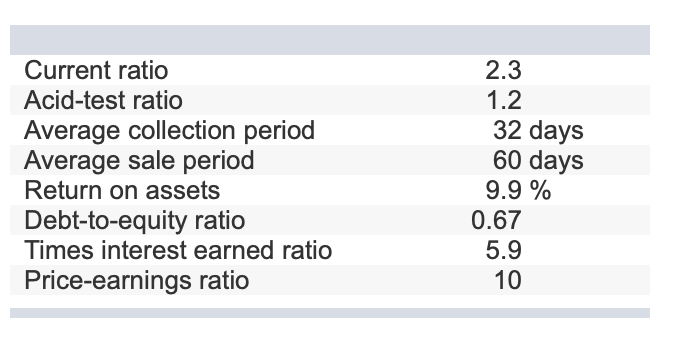
To begin your assigment you gather the following financial data and ratios that are typical of companies in Lydex Companys industry:
( Current ratio2.3 Acid-test ratio1.2 Average collection period32 days Average sale period60 days Return on assets9.9 % Debt-to-equity ratio0.67 Times interest earned ratio5.9 Price-earnings ratio10 )
|
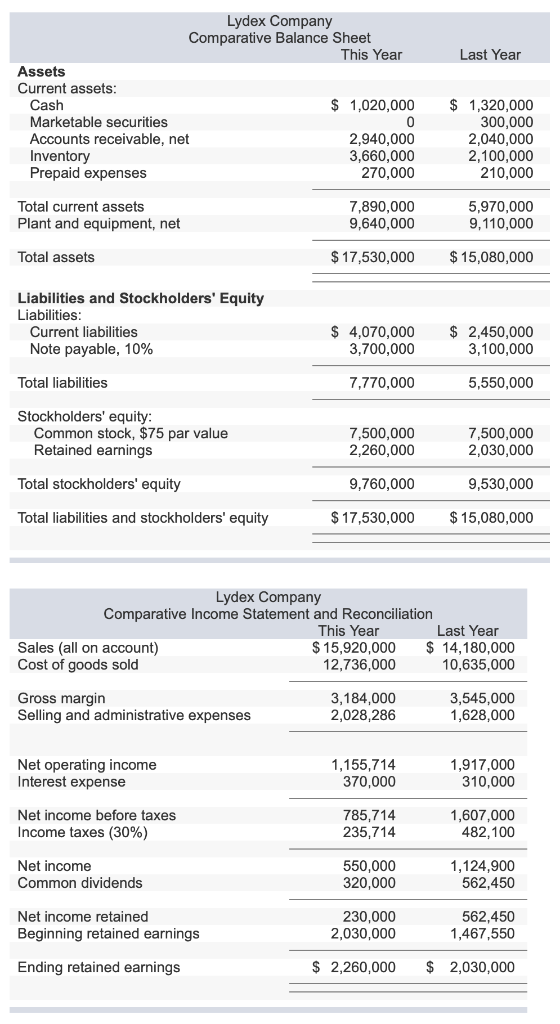
Lydex Company Comparative Balance Sheet This Year Last Year Assets Current assets Cash Marketable securities Accounts receivable, net Inventory Prepaid expenses $ 1,020,000$1,320,000 300,000 2,040,000 2,100,000 210,000 2,940,000 3,660,000 270,000 Total current assets Plant and equipment, net 7,890,000 9,640,000 5,970,000 9,110,000 Total assets $17,530,000$15,080,000 Liabilities and Stockholders' Equity Liabilities Current liabilities Note payable, 10% $ 4,070,000 3,700,000 $ 2,450,000 3,100,000 Total liabilities 7,770,000 5,550,000 Stockholders' equity Common stock, $75 par value Retained earnings 7,500,000 2,260,000 7,500,000 2,030,000 9,530,000 $17,530,000 $15,080,000 Total stockholders' equity 9,760,000 Total liabilities and stockholders' equity Lydex Company Comparative Income Statement and Reconciliation This Year Last Year Sales (all on account) Cost of goods sold $15,920,000 12,736,000 14,180,000 10,635,000 Gross margin Selling and administrative expenses 3,184,000 2,028,286 3,545,000 1,628,000 Net operating income Interest expense 1,155,714 370,000 1,917,000 310,000 Net income before taxes Income taxes (30%) 785,714 235,714 1,607,000 482,100 Net income Common dividends 550,000 320,000 1,124,900 562,450 Net income retained Beginning retained earnings 230,000 2,030,000 562,450 1,467,550 Ending retained earnings $ 2,260,000 $ 2,030,000 Current ratio Acid-test ratio Average collection period Average sale period Return on assets Debt-to-equity ratio Times interest earned ratio Price-earnings ratio 2.3 1.2 32 days 60 days 9.9% 0.67 5.9 10
Step by Step Solution
There are 3 Steps involved in it
Step: 1

Get Instant Access to Expert-Tailored Solutions
See step-by-step solutions with expert insights and AI powered tools for academic success
Step: 2

Step: 3
Ace Your Homework with AI
Get the answers you need in no time with our AI-driven, step-by-step assistance
Get Started
Managerial Accounting Special Edition For California State University Los Angeles
Authors: Garrison
14th Edition
0077519973, 978-0077519971