Question
You have just been hired by Intel in its finance division. Your first assignment is to determine the net cash flows and NPV of a
You have just been hired by Intel in its finance division. Your first assignment is to determine the net cash flows and NPV of a proposed new generation of mobile chips.
Capital expenditures to produce the new chips will initially require an investment of $1.2 billion. The R&D that will be required to finish the chips is $500 million this year. Any ongoing R&D for upgrades will be covered in the margin calculation in 2a below. The product family is expected to have a life of five years. First-year revenues for the new chip are expected to be $2,000,000,000 ($2,000 million). The chip familys revenues are expected to grow by 20% for the second year, and then decrease by 10% for the third, decrease by 20% for the 4th and finally decrease by 50% for the 5th (final) year of sales. Your job is to determine the rest of the cash flows associated with this project. Your boss has indicated that the operating costs and net working capital requirements are similar to the rest of the companys products. Since your boss hasnt been much help, here are some tips to guide your analysis:
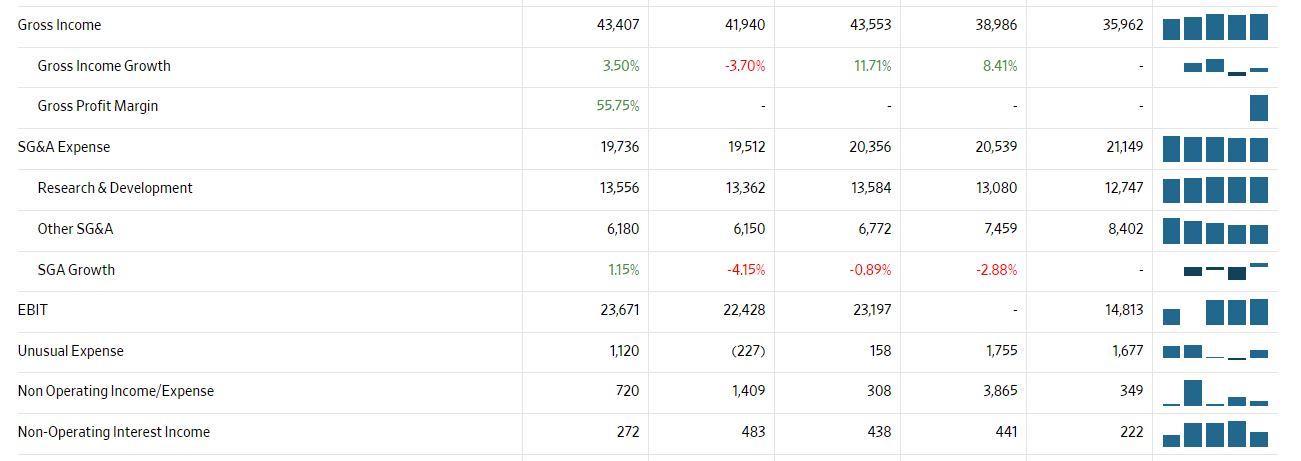
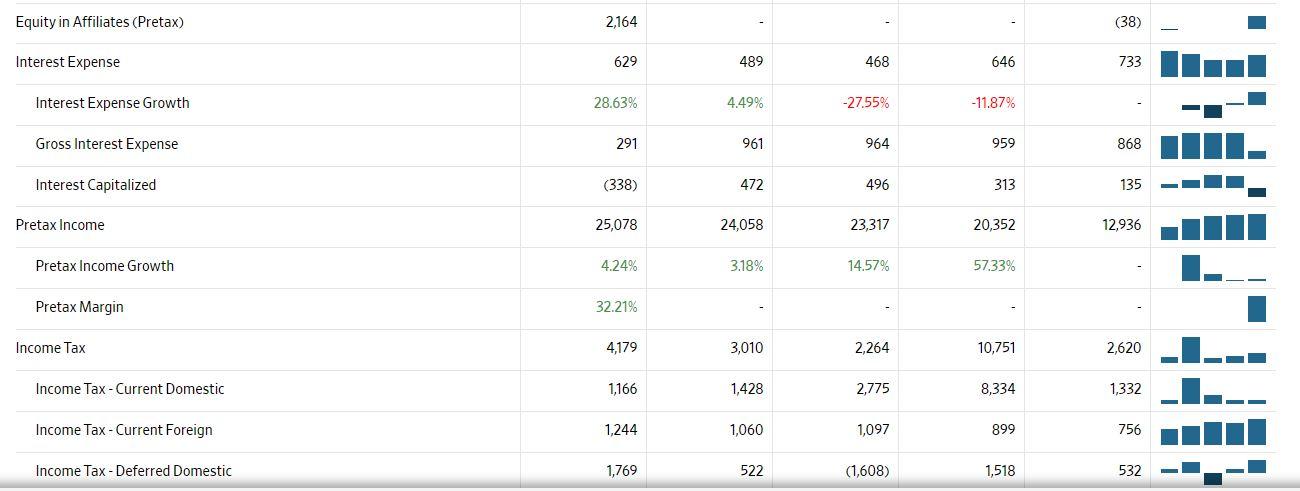
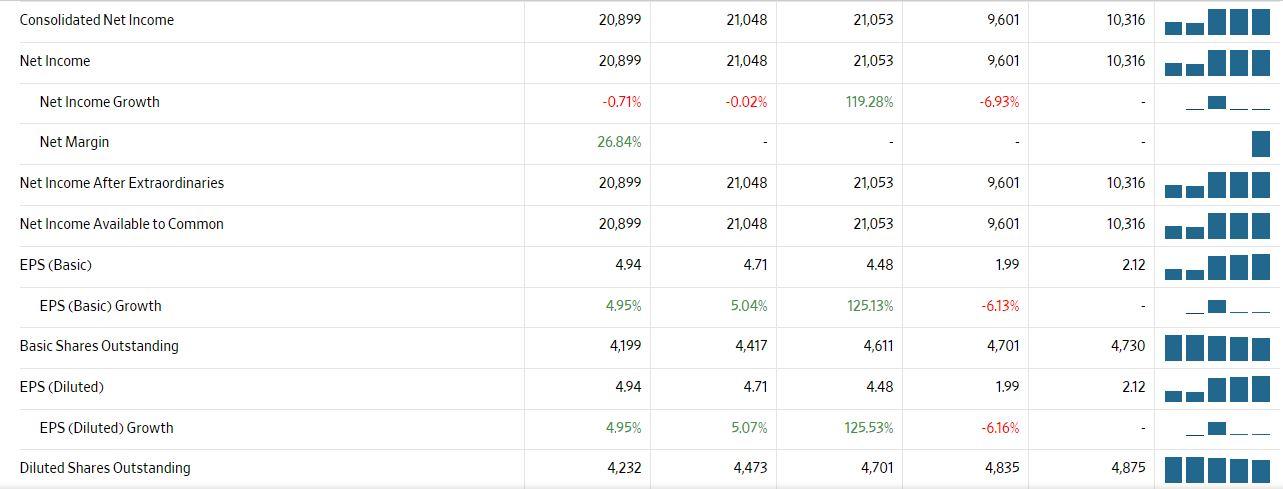
Obtain Intels financial statements. Download the annual income statements and balance sheets for the last four fiscal years from Wall Street Journal. You are now ready to determine the free cash flow. Compute the free cash flow for each year using Eq. 9.6 from this chapter showing all steps :


 Set up the timeline and computation of the free cash flow in separate, contiguous columns for each year of the project life. Be sure to make outflows negative and inflows positive.
a. Assume that the projects profitability will be similar to Intels existing projectsin 2015 and estimate costs each year by using the 2015 ratio of non-depreciation costs to revenue:
[(Cost of Revenue + SG&A + R&D)/ Total Revenue]
You should assume that this ratio will hold for this project as well. You do not need to break out the individual components of operating costs in your forecast. Simply forecast the total of Cost of Revenue + SG&A + R&D for each year.
b. Determine the annual depreciation by assuming Intel depreciates these assets by the straight-line method over a 5-year life.
c. Determine Intels tax rate as [1 - (Income After Tax/Income Before Tax)] in 2015. Note that on Intels income statement on Google Finance, there is a difference between operating income and income before tax. That difference is due to small adjustments. Ignore this issue and simply focus on the Income Before Tax line.
d. Calculate the net working capital required each year by assuming that the level of NWC will be a constant percentage of the projects sales. Use Intels 2015 NWC/Sales to estimate the required percentage. (Use only accounts receivable, accounts payable, and inventory to measure working capital. Other components of current assets and liabilities are harder to interpret and are not necessarily reflective of the projects required NWCe.g., Intels cash holdings.)
e. To determine the free cash flow, calculate the additional capital investment and the change in net working capital each year.
3. Determine the IRR of the project and the NPV of the project at a cost of capital of 12% using the Excel functions. For the calculation of NPV,
include (i.e., = NPV1rate, CF1CF5 2 + CF0 2. For IRR, include cash flows 0 through 5 in cash flows 1 through 5 in the NPV function and then subtract the initial cost the cash flow range.
Free Cash Flow = (Revenues - Costs - Depreciation) * (1 - Tax Rate) Depreciation - CapEx - Change in Nwc/ Fiscal year is January-December. All values USD Millions 2020 2019 2018 2017 2016 5-year trend Sales/Revenue 77,867 71,965 70,848 62,761 59,387 Sales Growth 8.20% 1.58% 12.89% 5.68% Cost of Goods Sold (COGS) incl. D&A 34,460 30,025 27,295 23,775 23,425 COGS excluding D&A 22,221 19,199 18,210 15,646 15,635 Depreciation & Amortization Expense 12,239 10,826 9,085 8,129 7,790 Depreciation 10,482 9,204 7,520 6,752 6,266 Amortization of Intangibles 1,757 1,622 1,565 1,377 1,524 COGS Growth 14.77% 10.00% 14.81% 1.49% Gross Income 43,407 41,940 43,553 38,986 35,962 Gross Income 43,407 41,940 43,553 38,986 35,962 Gross Income Growth 3.50% -3.70% 11.71% 8.41% Gross Profit Margin 55,75% SG&A Expense 19,736 19,512 20,356 20,539 21,149 Research & Development 13,556 13,362 13,584 13,080 12,747 Other SG&A 6,180 6,150 6,772 7,459 8,402 SGA Growth 1.15% -4.15% -0.89% -2.88% EBIT 23,671 22,428 23,197 14,813 Unusual Expense 1,120 (227) 158 1,755 1,677 Non Operating Income/Expense 720 1,409 308 3,865 349 Non-Operating Interest Income 272 483 438 441 222 Equity in Affiliates (Pretax) 2,164 (38) Interest Expense 629 489 468 646 733 Interest Expense Growth 28.63% 4.49% -27.55% -11.87% Gross Interest Expense 291 961 964 959 868 Interest Capitalized (338) 472 496 313 135 Pretax Income 25,078 24,058 23,317 20,352 12,936 Pretax Income Growth 4.24% 3.18% 14.57% 57.33% Pretax Margin 32.21% Income Tax 4,179 3,010 2,264 10,751 2,620 Income Tax - Current Domestic 1,166 1,428 2,775 8,334 1,332 Income Tax - Current Foreign 1,244 1,060 1,097 899 756 Income Tax-Deferred Domestic 1,769 522 (1,608) 1,518 532 Consolidated Net Income 20,899 21,048 21,053 9,601 10,316 Net Income 20,899 21,048 21,053 9,601 10,316 Net Income Growth -0.71% -0.02% 119.28% -6.93% Net Margin 26,84% Net Income After Extraordinaries 20,899 21,048 21,053 9,601 10,316 Net Income Available to Common 20,899 21,048 21,053 9,601 10,316 EPS (Basic) 4.94 4.71 4.48 1.99 2.12 EPS (Basic) Growth 4.95% 5.04% 125.13% -6.13% Basic Shares Outstanding 4,199 4,417 4,611 4,701 4.730 EPS (Diluted) 4.94 4.71 4.48 1.99 2.12 EPS (Diluted) Growth 4.95% 5,07% 125.53% -6.16% Diluted Shares Outstanding 4,232 4,473 4,701 4,835 4,875 EBITDA 35,910 33,254 32,282 26,576 22.603 EBITDA Growth 7.99% 3.01% 21.47% 17.58% EBITDA Margin 46.12% EBIT 23,671 22,428 23,197 14,813 Free Cash Flow = (Revenues - Costs - Depreciation) * (1 - Tax Rate) Depreciation - CapEx - Change in Nwc/ Fiscal year is January-December. All values USD Millions 2020 2019 2018 2017 2016 5-year trend Sales/Revenue 77,867 71,965 70,848 62,761 59,387 Sales Growth 8.20% 1.58% 12.89% 5.68% Cost of Goods Sold (COGS) incl. D&A 34,460 30,025 27,295 23,775 23,425 COGS excluding D&A 22,221 19,199 18,210 15,646 15,635 Depreciation & Amortization Expense 12,239 10,826 9,085 8,129 7,790 Depreciation 10,482 9,204 7,520 6,752 6,266 Amortization of Intangibles 1,757 1,622 1,565 1,377 1,524 COGS Growth 14.77% 10.00% 14.81% 1.49% Gross Income 43,407 41,940 43,553 38,986 35,962 Gross Income 43,407 41,940 43,553 38,986 35,962 Gross Income Growth 3.50% -3.70% 11.71% 8.41% Gross Profit Margin 55,75% SG&A Expense 19,736 19,512 20,356 20,539 21,149 Research & Development 13,556 13,362 13,584 13,080 12,747 Other SG&A 6,180 6,150 6,772 7,459 8,402 SGA Growth 1.15% -4.15% -0.89% -2.88% EBIT 23,671 22,428 23,197 14,813 Unusual Expense 1,120 (227) 158 1,755 1,677 Non Operating Income/Expense 720 1,409 308 3,865 349 Non-Operating Interest Income 272 483 438 441 222 Equity in Affiliates (Pretax) 2,164 (38) Interest Expense 629 489 468 646 733 Interest Expense Growth 28.63% 4.49% -27.55% -11.87% Gross Interest Expense 291 961 964 959 868 Interest Capitalized (338) 472 496 313 135 Pretax Income 25,078 24,058 23,317 20,352 12,936 Pretax Income Growth 4.24% 3.18% 14.57% 57.33% Pretax Margin 32.21% Income Tax 4,179 3,010 2,264 10,751 2,620 Income Tax - Current Domestic 1,166 1,428 2,775 8,334 1,332 Income Tax - Current Foreign 1,244 1,060 1,097 899 756 Income Tax-Deferred Domestic 1,769 522 (1,608) 1,518 532 Consolidated Net Income 20,899 21,048 21,053 9,601 10,316 Net Income 20,899 21,048 21,053 9,601 10,316 Net Income Growth -0.71% -0.02% 119.28% -6.93% Net Margin 26,84% Net Income After Extraordinaries 20,899 21,048 21,053 9,601 10,316 Net Income Available to Common 20,899 21,048 21,053 9,601 10,316 EPS (Basic) 4.94 4.71 4.48 1.99 2.12 EPS (Basic) Growth 4.95% 5.04% 125.13% -6.13% Basic Shares Outstanding 4,199 4,417 4,611 4,701 4.730 EPS (Diluted) 4.94 4.71 4.48 1.99 2.12 EPS (Diluted) Growth 4.95% 5,07% 125.53% -6.16% Diluted Shares Outstanding 4,232 4,473 4,701 4,835 4,875 EBITDA 35,910 33,254 32,282 26,576 22.603 EBITDA Growth 7.99% 3.01% 21.47% 17.58% EBITDA Margin 46.12% EBIT 23,671 22,428 23,197 14,813Step by Step Solution
There are 3 Steps involved in it
Step: 1

Get Instant Access to Expert-Tailored Solutions
See step-by-step solutions with expert insights and AI powered tools for academic success
Step: 2

Step: 3

Ace Your Homework with AI
Get the answers you need in no time with our AI-driven, step-by-step assistance
Get Started


