Question
You have just been hired by Internal Business Machines Corporation (IBM) in their capital budgeting division. Your first assignment is to determine the free cash
You have just been hired by Internal Business Machines Corporation (IBM) in their capital budgeting division. Your first assignment is to determine the free cash flows and NPV of a proposed new type of tablet computer similar in size to an iPad but with the operating power of a high-end desktop system. Please read the descriptions given in the case for all the details you will need for your analysis. Using that information, create a capital budgeting model in the same or similar way, as described in the chapter, using Excel.
Obtain IBMs financial statements (2020, 2019, 2018, 2017).Download the annual income statements, balance sheets, and cash flow statements for the last four fiscal years from Yahoo! Finance (finance.yahoo.com). Enter IBMs ticker symbol and then go to financials.
1. Estimate the Free Cash Flow for the new product. Compute the Free Cash Flow for each year: FreeCashFlow = (Revenues - Costs - Depreciation) * (1 - tc) + Depreciation - CapEx - NWC Set up the timeline and computation of free cash flow in separate, contiguous columns for each year of the project life. Be sure to make outflows negative and inflows positive.
a. Assume that the projects profitability will be similar to IBMs existing projects in the latest fiscal year and estimate (revenues - costs) each year by using the latest EBITDA/Sales profit margin. Calculate EBITDA as EBIT plus Depreciation expense from the cash flow statement
b. Determine the annual depreciation by assuming that IBM depreciates these assets by the straightline method over a five-year life.
c. Determine IBMs tax rate by using the current U.S. federal corporate income tax rate.
d. Calculate the net working capital required each year by assuming that the level of NWC will be a constant percentage of the projects sales. Use IBMs NWC/Sales for the latest fiscal year to estimate the required percentage. (Use only accounts receivable, accounts payable, and inventory to measure working capital. Other components of current assets and liabilities are harder to interpret and not necessarily reflective of the projects required NWCfor example, IBMs cash holdings.)
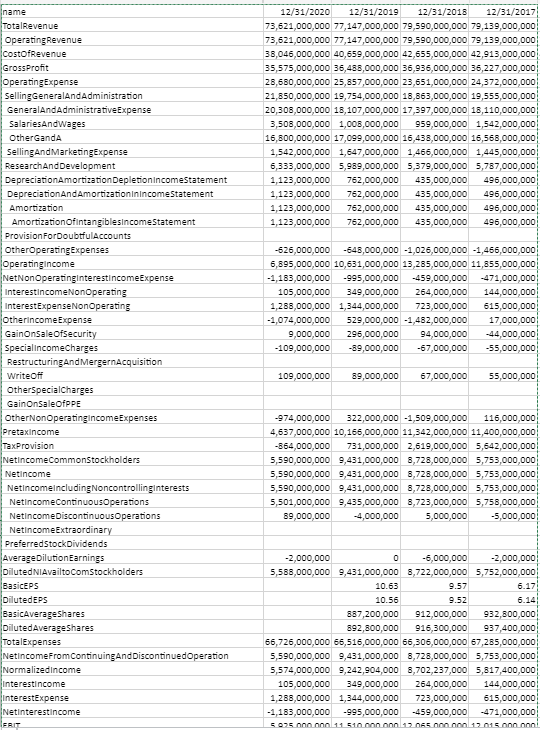
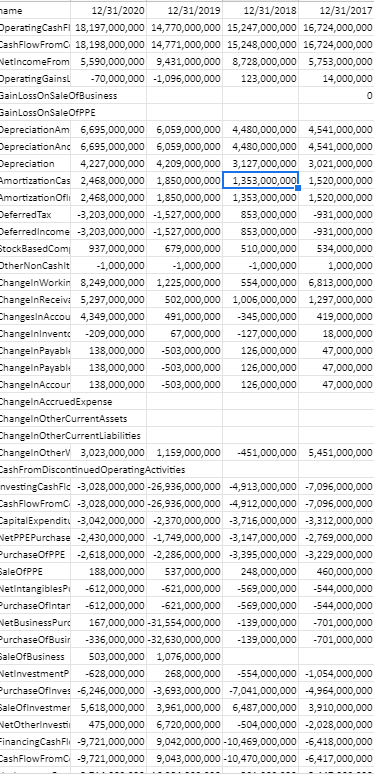
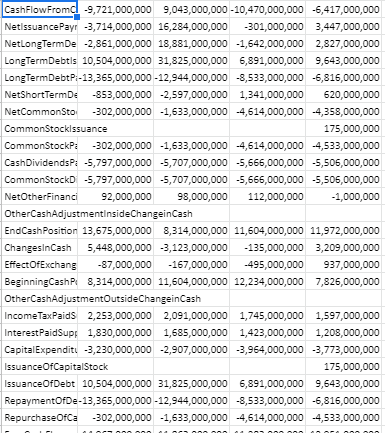
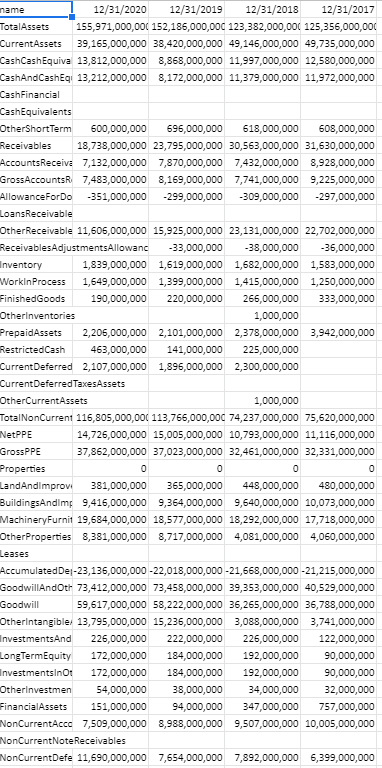
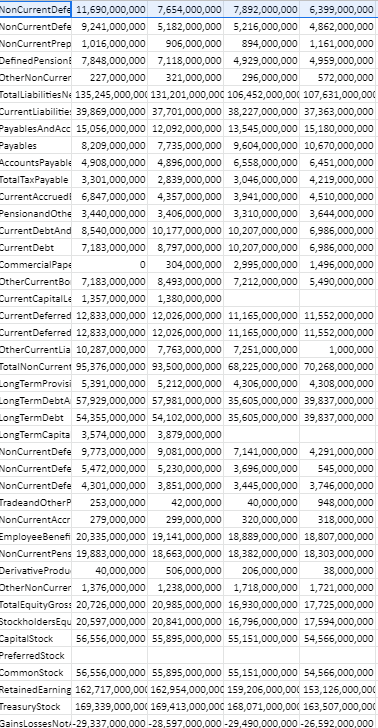
12/31/2020 12/31/2019 12/31/2018 12/31/2017 73,621,000,000 77,147,000,000 79,590,000,000 79,139,000,000 73,621,000,000 77,147,000,000 79,590,000,000 79,139,000,000 38,045,000,000 40,659,000,000 42,655,000,000 42,913,000,000 35,575,000,000 36,483,000,000 36,936,000,000 35,227,000,000 28,680,000,000 25,857,000,000 23,651,000,000 24,372,000,000 21,850,000,000 19,754,000,000 18,863,000,000 19,555,000,000 20,308,000,000 18,107,000,000 17,397,000,000 18,110,000,000 3,508,000,000 1,000,000,000 959,000,000 1,542,000,000 16,800,000,000 17,099,000,000 16,438,000,000 16,568,000,000 1,542,000,000 1,647,000,000 1,465,000,000 1,445,000,000 6,333,000,000 5,989,000,000 5,379,000,000 5,787,000,000 1,123,000,000 762,000,000 435,000,000 495,000,000 1,123,000,000 762,000,000 435,000,000 496,000,000 1,123,000,000 762,000,000 435,000,000 495,000,000 1,123,000,000 762,000,000 435,000,000 496,000,000 - 526,000,000 -648,000,000 -1,025,000,000 -1,456,000,000 6,895,000,000 10,631,000,000 13,285,000,000 11,855,000,000 -1,183,000,000 -995,000,000 -459,000,000 -471,000,000 105,000,000 349,000,000 264,000,000 144,000,000 1,288,000,000 1,344,000,000 723,000,000 615,000,000 -1,074,000,000 529,000,000 -1,482,000,000 17,000,000 9,000,000 295,000,000 94,000,000 44,000,000 -109,000,000 -89,000,000 -67,000,000 -55,000,000 name TotalRevenue OperatingRevenue CostofRevenue GrossProfit Operating Expense SellingGeneralAndAdministration General AndAdministrative Expense SalariesAndwages OtherGanda SellingAnd MarketingExpense ResearchAnd Development Depreciation Amortization DepletionincomeStatement Depreciation And Amortizationinincome Statement Amortization Amortizationofintangiblesincome Statement ProvisionForDoubtful Accounts OtherOperatingExpenses Operatingincome NetNonOperatinginterestincomeExpense InterestincomeNonOperating InterestExpenseNonOperating Otherincome Expense GainonsaleOfsecurity Specialincomecharges RestructuringAndMergernAcquisition Writeoff OtherSpecialcharges GainOnSaleOfPPE OtherNon Operatingincome Expenses Pretax income TaxProvision NetincomeCommonStockholders Netincome NetlncomelncludingNoncontrollinginterests NetincomeContinuousOperations Netincome DiscontinuousOperations NetincomeExtraordinary PreferredStock Dividends Average DilutionEarnings DilutedNIAvailtoComstockholders BasicEPS DilutedEPS BasicAverageShares Diluted Average Shares TotalExpenses NetincomeFromContinuingAnd DiscontinuedOperation Normalizedincome Interestincome InterestExpense Netinterestincome 109,000,000 89,000,000 67,000,000 55,000,000 -974,000,000 322,000,000 -1,509,000,000 116,000,000 4,637,000,000 10,165,000,000 11,342,000,000 11,400,000,000 -864,000,000 731,000,000 2,619,000,000 5,642,000,000 5,590,000,000 9,431,000,000 8,728,000,000 5,753,000,000 5,590,000,000 9,431,000,000 8,728,000,000 5,753,000,000 5,590,000,000 9,431,000,000 3,728,000,000 5,753,000,000 5,501,000,000 9,435,000,000 8,723,000,000 5,758,000,000 89,000,000 -4,000,000 5,000,000 -5,000,000 -2,000,000 0 -6,000,000 -2,000,000 5,588,000,000 9,431,000,000 8,722,000,000 5,752,000,000 10.63 9.57 6.17 10.56 9.52 887,200,000 912,000,000 932,800,000 892,800,000 916,300,000 937,400,000 66,725,000,000 65,516,000,000 56,305,000,000 67,285,000,000 5,590,000,000 9,431,000,000 8,728,000,000 5,753,000,000 5,574,000,000 9,242,904,000 8,702,237,000 5,817,400,000 105,000,000 349,000,000 264,000,000 144,000,000 1,288,000,000 1,344,000,000 723,000,000 615,000,000 -1,183,000,000 -995,000,000 -459,000,000 471,000,000 5.025.000000 11 510 000 000 12 065 000 000 12.015.000 non name 12/31/2020 12/31/2019 12/31/2018 12/31/2017 Operating Cash Fl 18,197,000,000 14,770,000,000 15,247,000,000 15,724,000,000 Cash Flow From 18,198,000,000 14,771,000,000 15,248,000,000 15,724,000,000 Netincome From 5,590,000,000 9,431,000,000 8,728,000,000 5,753,000,000 OperatingGainst -70,000,000 -1,096,000,000 123,000,000 14,000,000 BainLossOnSaleOfBusiness 0 Gain LossOnSaleOfPPE DepreciationAm 5,695,000,000 6,059,000,000 4,480,000,000 4,541,000,000 DepreciationAnc 6,695,000,000 6,059,000,000 4,480,000,000 4,541,000,000 Depreciation 4,227,000,000 4,209,000,000 3,127,000,000 3,021,000,000 AmortizationCas 2,468,000,000 1,850,000,000 1,353,000,000 1,520,000,000 Amortization Ofli 2,468,000,000 1,850,000,000 1,353,000,000 1,520,000,000 Deferred Tax -3,203,000,000 -1,527,000,000 853,000,000 -931,000,000 Deferredincome -3,203,000,000 -1,527,000,000 853,000,000 -931,000,000 StockBasedComi 937,000,000 679,000,000 510,000,000 534,000,000 OtherNonCashit -1,000,000 - 1,000,000 -1,000,000 1,000,000 ChangelnWorkin 8,249,000,000 1,225,000,000 554,000,000 5,813,000,000 ChangelnReceiv: 5,297,000,000 502,000,000 1,005,000,000 1,297,000,000 ChangesInAccou 4,349,000,000 491,000,000 -345,000,000 419,000,000 Changelnlnvento -209,000,000 67,000,000 - 127,000,000 18,000,000 Changeln Payable 138,000,000 -503,000,000 126,000,000 47,000,000 ChangelnPayable 138,000,000 -503,000,000 126,000,000 47,000,000 ChangeInAccour 138,000,000 -503,000,000 126,000,000 47,000,000 Changeln AccruedExpense Changeln OtherCurrentAssets ChangelnOtherCurrentLiabilities ChangelnOtherV 3,023,000,000 1,159,000,000 -451,000,000 5,451,000,000 CashFromDiscontinued OperatingActivities nvestingCashFic -3,028,000,000 -25,935,000,000 -4,913,000,000 -7,095,000,000 CashFlow From -3,028,000,000 -26,936,000,000 -4,912,000,000 -7,095,000,000 CapitalExpendit. -3,042,000,000 -2,370,000,000 -3,715,000,000 -3,312,000,000 NetPPEPurchase -2,430,000,000 -1,749,000,000 -3,147,000,000 -2,769,000,000 Purchase OfPPE -2,618,000,000 -2,285,000,000 -3,395,000,000 -3,229,000,000 SaleOfPP: 188,000,000 537,000,000 248,000,000 460,000,000 Netintangibles -612,000,000 -621,000,000 -569,000,000 -544,000,000 Purchase Ofintar -612,000,000 -621,000,000 -569,000,000 -544,000,000 NetBusinessPurc 167,000,000 -31,554,000,000 - 139,000,000 -701,000,000 Purchase OfBusir -335,000,000 -32,630,000,000 - 139,000,000 -701,000,000 saleOfTusiness 503,000,000 1,076,000,000 Netinvestment -628,000,000 268,000,000 -554,000,000 -1,054,000,000 Purchase OfInves -6,245,000,000 -3,693,000,000 -7,041,000,000 -4,964,000,000 aleOffnvestmer 5,518,000,000 3,961,000,000 5,487,000,000 3,510,000,000 NetOtherinvestii 475,000,000 6,720,000,000 -504,000,000 -2,028,000,000 FinancingCashFl-9,721,000,000 9,042,000,000 -10,469,000,000 -6,418,000,000 CashFlow From -9,721,000,000 9,043,000,000 -10,470,000,000 -6,417,000,000 name 12/31/2020 12/31/2019 12/31/2018 12/31/2017 TotalAssets 155,971,000,000 152,185,000,000 123,382,000,000 125,356,000,000 CurrentAssets 39,165,000,000 38,420,000,000 49,145,000,000 49,735,000,000 CashCashEquiva 13,812,000,000 8,868,000,000 11,997,000,000 12,580,000,000 CashAndCashEq 13,212,000,000 8,172,000,000 11,379,000,000 11,972,000,000 CashFinancial CashEquivalents OtherShort Term 600,000,000 696,000,000 618,000,000 608,000,000 Receivables 18,738,000,000 23,795,000,000 30,563,000,000 31,630,000,000 Accounts Receiva 7,132,000,000 7,870,000,000 7,432,000,000 8,928,000,000 Gross Accounts 7,483,000,000 8,159,000,000 7,741,000,000 9,225,000,000 Allowance ForDo -351,000,000 -299,000,000 -309,000,000 -297,000,000 Loans Receivable OtherReceivable 11,605,000,000 15,925,000,000 23,131,000,000 22,702,000,000 ReceivablesAdjustments Allowanc -33,000,000 -38,000,000 -36,000,000 Inventory 1,839,000,000 1,619,000,000 1,682,000,000 1,583,000,000 Workin Process 1,549,000,000 1,399,000,000 1,415,000,000 1,250,000,000 Finished Goods 190,000,000 220,000,000 266,000,000 333,000,000 Otherinventories 1,000,000 PrepaidAssets 2,205,000,000 2,101,000,000 2,378,000,000 3,942,000,000 Restricted Cash 463,000,000 141,000,000 225,000,000 Current Deferred 2,107,000,000 1,896,000,000 2,300,000,000 CurrentDeferred TaxesAssets OtherCurrentAssets 1,000,000 TotalNonCurrent 115,805,000,000 113,765,000,000 74,237,000,000 75,620,000,000 NetPPE 14,726,000,000 15,005,000,000 10,793,000,000 11,116,000,000 GrossPPE 37,862,000,000 37,023,000,000 32,461,000,000 32,331,000,000 Properties 0 0 0 0 LandAndimprovi 381,000,000 365,000,000 448,000,000 480,000,000 BuildingsAndime 9,415,000,000 9,364,000,000 9,540,000,000 10,073,000,000 MachineryFurnit 19,684,000,000 18,577,000,000 18,292,000,000 17,718,000,000 Other Properties 8,381,000,000 8,717,000,000 4,081,000,000 4,050,000,000 Leases Accumulated De:-23,135,000,000 -22,018,000,000 -21,568,000,000 -21,215,000,000 GoodwillAnd Ott 73,412,000,000 73,458,000,000 39,353,000,000 40,529,000,000 Goodwill 59,617,000,000 58,222,000,000 36,265,000,000 36,788,000,000 Otherintangible: 13,795,000,000 15,236,000,000 3,088,000,000 3,741,000,000 InvestmentsAnd 226,000,000 222,000,000 226,000,000 122,000,000 LongTermEquity 172,000,000 184,000,000 192,000,000 90,000,000 Investmentsinot 172,000,000 184,000,000 192,000,000 90,000,000 Otherinvestmen 54,000,000 38,000,000 34,000,000 32,000,000 FinancialAssets 151,000,000 94,000,000 347,000,000 757,000,000 NonCurrentAcco 7,509,000,000 8,988,000,000 9,507,000,000 10,005,000,000 NonCurrentNote Receivables NonCurrentDefe 11,690,000,000 7,654,000,000 7,892,000,000 6,399,000,000 12/31/2020 12/31/2019 12/31/2018 12/31/2017 73,621,000,000 77,147,000,000 79,590,000,000 79,139,000,000 73,621,000,000 77,147,000,000 79,590,000,000 79,139,000,000 38,045,000,000 40,659,000,000 42,655,000,000 42,913,000,000 35,575,000,000 36,483,000,000 36,936,000,000 35,227,000,000 28,680,000,000 25,857,000,000 23,651,000,000 24,372,000,000 21,850,000,000 19,754,000,000 18,863,000,000 19,555,000,000 20,308,000,000 18,107,000,000 17,397,000,000 18,110,000,000 3,508,000,000 1,000,000,000 959,000,000 1,542,000,000 16,800,000,000 17,099,000,000 16,438,000,000 16,568,000,000 1,542,000,000 1,647,000,000 1,465,000,000 1,445,000,000 6,333,000,000 5,989,000,000 5,379,000,000 5,787,000,000 1,123,000,000 762,000,000 435,000,000 495,000,000 1,123,000,000 762,000,000 435,000,000 496,000,000 1,123,000,000 762,000,000 435,000,000 495,000,000 1,123,000,000 762,000,000 435,000,000 496,000,000 - 526,000,000 -648,000,000 -1,025,000,000 -1,456,000,000 6,895,000,000 10,631,000,000 13,285,000,000 11,855,000,000 -1,183,000,000 -995,000,000 -459,000,000 -471,000,000 105,000,000 349,000,000 264,000,000 144,000,000 1,288,000,000 1,344,000,000 723,000,000 615,000,000 -1,074,000,000 529,000,000 -1,482,000,000 17,000,000 9,000,000 295,000,000 94,000,000 44,000,000 -109,000,000 -89,000,000 -67,000,000 -55,000,000 name TotalRevenue OperatingRevenue CostofRevenue GrossProfit Operating Expense SellingGeneralAndAdministration General AndAdministrative Expense SalariesAndwages OtherGanda SellingAnd MarketingExpense ResearchAnd Development Depreciation Amortization DepletionincomeStatement Depreciation And Amortizationinincome Statement Amortization Amortizationofintangiblesincome Statement ProvisionForDoubtful Accounts OtherOperatingExpenses Operatingincome NetNonOperatinginterestincomeExpense InterestincomeNonOperating InterestExpenseNonOperating Otherincome Expense GainonsaleOfsecurity Specialincomecharges RestructuringAndMergernAcquisition Writeoff OtherSpecialcharges GainOnSaleOfPPE OtherNon Operatingincome Expenses Pretax income TaxProvision NetincomeCommonStockholders Netincome NetlncomelncludingNoncontrollinginterests NetincomeContinuousOperations Netincome DiscontinuousOperations NetincomeExtraordinary PreferredStock Dividends Average DilutionEarnings DilutedNIAvailtoComstockholders BasicEPS DilutedEPS BasicAverageShares Diluted Average Shares TotalExpenses NetincomeFromContinuingAnd DiscontinuedOperation Normalizedincome Interestincome InterestExpense Netinterestincome 109,000,000 89,000,000 67,000,000 55,000,000 -974,000,000 322,000,000 -1,509,000,000 116,000,000 4,637,000,000 10,165,000,000 11,342,000,000 11,400,000,000 -864,000,000 731,000,000 2,619,000,000 5,642,000,000 5,590,000,000 9,431,000,000 8,728,000,000 5,753,000,000 5,590,000,000 9,431,000,000 8,728,000,000 5,753,000,000 5,590,000,000 9,431,000,000 3,728,000,000 5,753,000,000 5,501,000,000 9,435,000,000 8,723,000,000 5,758,000,000 89,000,000 -4,000,000 5,000,000 -5,000,000 -2,000,000 0 -6,000,000 -2,000,000 5,588,000,000 9,431,000,000 8,722,000,000 5,752,000,000 10.63 9.57 6.17 10.56 9.52 887,200,000 912,000,000 932,800,000 892,800,000 916,300,000 937,400,000 66,725,000,000 65,516,000,000 56,305,000,000 67,285,000,000 5,590,000,000 9,431,000,000 8,728,000,000 5,753,000,000 5,574,000,000 9,242,904,000 8,702,237,000 5,817,400,000 105,000,000 349,000,000 264,000,000 144,000,000 1,288,000,000 1,344,000,000 723,000,000 615,000,000 -1,183,000,000 -995,000,000 -459,000,000 471,000,000 5.025.000000 11 510 000 000 12 065 000 000 12.015.000 non name 12/31/2020 12/31/2019 12/31/2018 12/31/2017 Operating Cash Fl 18,197,000,000 14,770,000,000 15,247,000,000 15,724,000,000 Cash Flow From 18,198,000,000 14,771,000,000 15,248,000,000 15,724,000,000 Netincome From 5,590,000,000 9,431,000,000 8,728,000,000 5,753,000,000 OperatingGainst -70,000,000 -1,096,000,000 123,000,000 14,000,000 BainLossOnSaleOfBusiness 0 Gain LossOnSaleOfPPE DepreciationAm 5,695,000,000 6,059,000,000 4,480,000,000 4,541,000,000 DepreciationAnc 6,695,000,000 6,059,000,000 4,480,000,000 4,541,000,000 Depreciation 4,227,000,000 4,209,000,000 3,127,000,000 3,021,000,000 AmortizationCas 2,468,000,000 1,850,000,000 1,353,000,000 1,520,000,000 Amortization Ofli 2,468,000,000 1,850,000,000 1,353,000,000 1,520,000,000 Deferred Tax -3,203,000,000 -1,527,000,000 853,000,000 -931,000,000 Deferredincome -3,203,000,000 -1,527,000,000 853,000,000 -931,000,000 StockBasedComi 937,000,000 679,000,000 510,000,000 534,000,000 OtherNonCashit -1,000,000 - 1,000,000 -1,000,000 1,000,000 ChangelnWorkin 8,249,000,000 1,225,000,000 554,000,000 5,813,000,000 ChangelnReceiv: 5,297,000,000 502,000,000 1,005,000,000 1,297,000,000 ChangesInAccou 4,349,000,000 491,000,000 -345,000,000 419,000,000 Changelnlnvento -209,000,000 67,000,000 - 127,000,000 18,000,000 Changeln Payable 138,000,000 -503,000,000 126,000,000 47,000,000 ChangelnPayable 138,000,000 -503,000,000 126,000,000 47,000,000 ChangeInAccour 138,000,000 -503,000,000 126,000,000 47,000,000 Changeln AccruedExpense Changeln OtherCurrentAssets ChangelnOtherCurrentLiabilities ChangelnOtherV 3,023,000,000 1,159,000,000 -451,000,000 5,451,000,000 CashFromDiscontinued OperatingActivities nvestingCashFic -3,028,000,000 -25,935,000,000 -4,913,000,000 -7,095,000,000 CashFlow From -3,028,000,000 -26,936,000,000 -4,912,000,000 -7,095,000,000 CapitalExpendit. -3,042,000,000 -2,370,000,000 -3,715,000,000 -3,312,000,000 NetPPEPurchase -2,430,000,000 -1,749,000,000 -3,147,000,000 -2,769,000,000 Purchase OfPPE -2,618,000,000 -2,285,000,000 -3,395,000,000 -3,229,000,000 SaleOfPP: 188,000,000 537,000,000 248,000,000 460,000,000 Netintangibles -612,000,000 -621,000,000 -569,000,000 -544,000,000 Purchase Ofintar -612,000,000 -621,000,000 -569,000,000 -544,000,000 NetBusinessPurc 167,000,000 -31,554,000,000 - 139,000,000 -701,000,000 Purchase OfBusir -335,000,000 -32,630,000,000 - 139,000,000 -701,000,000 saleOfTusiness 503,000,000 1,076,000,000 Netinvestment -628,000,000 268,000,000 -554,000,000 -1,054,000,000 Purchase OfInves -6,245,000,000 -3,693,000,000 -7,041,000,000 -4,964,000,000 aleOffnvestmer 5,518,000,000 3,961,000,000 5,487,000,000 3,510,000,000 NetOtherinvestii 475,000,000 6,720,000,000 -504,000,000 -2,028,000,000 FinancingCashFl-9,721,000,000 9,042,000,000 -10,469,000,000 -6,418,000,000 CashFlow From -9,721,000,000 9,043,000,000 -10,470,000,000 -6,417,000,000 name 12/31/2020 12/31/2019 12/31/2018 12/31/2017 TotalAssets 155,971,000,000 152,185,000,000 123,382,000,000 125,356,000,000 CurrentAssets 39,165,000,000 38,420,000,000 49,145,000,000 49,735,000,000 CashCashEquiva 13,812,000,000 8,868,000,000 11,997,000,000 12,580,000,000 CashAndCashEq 13,212,000,000 8,172,000,000 11,379,000,000 11,972,000,000 CashFinancial CashEquivalents OtherShort Term 600,000,000 696,000,000 618,000,000 608,000,000 Receivables 18,738,000,000 23,795,000,000 30,563,000,000 31,630,000,000 Accounts Receiva 7,132,000,000 7,870,000,000 7,432,000,000 8,928,000,000 Gross Accounts 7,483,000,000 8,159,000,000 7,741,000,000 9,225,000,000 Allowance ForDo -351,000,000 -299,000,000 -309,000,000 -297,000,000 Loans Receivable OtherReceivable 11,605,000,000 15,925,000,000 23,131,000,000 22,702,000,000 ReceivablesAdjustments Allowanc -33,000,000 -38,000,000 -36,000,000 Inventory 1,839,000,000 1,619,000,000 1,682,000,000 1,583,000,000 Workin Process 1,549,000,000 1,399,000,000 1,415,000,000 1,250,000,000 Finished Goods 190,000,000 220,000,000 266,000,000 333,000,000 Otherinventories 1,000,000 PrepaidAssets 2,205,000,000 2,101,000,000 2,378,000,000 3,942,000,000 Restricted Cash 463,000,000 141,000,000 225,000,000 Current Deferred 2,107,000,000 1,896,000,000 2,300,000,000 CurrentDeferred TaxesAssets OtherCurrentAssets 1,000,000 TotalNonCurrent 115,805,000,000 113,765,000,000 74,237,000,000 75,620,000,000 NetPPE 14,726,000,000 15,005,000,000 10,793,000,000 11,116,000,000 GrossPPE 37,862,000,000 37,023,000,000 32,461,000,000 32,331,000,000 Properties 0 0 0 0 LandAndimprovi 381,000,000 365,000,000 448,000,000 480,000,000 BuildingsAndime 9,415,000,000 9,364,000,000 9,540,000,000 10,073,000,000 MachineryFurnit 19,684,000,000 18,577,000,000 18,292,000,000 17,718,000,000 Other Properties 8,381,000,000 8,717,000,000 4,081,000,000 4,050,000,000 Leases Accumulated De:-23,135,000,000 -22,018,000,000 -21,568,000,000 -21,215,000,000 GoodwillAnd Ott 73,412,000,000 73,458,000,000 39,353,000,000 40,529,000,000 Goodwill 59,617,000,000 58,222,000,000 36,265,000,000 36,788,000,000 Otherintangible: 13,795,000,000 15,236,000,000 3,088,000,000 3,741,000,000 InvestmentsAnd 226,000,000 222,000,000 226,000,000 122,000,000 LongTermEquity 172,000,000 184,000,000 192,000,000 90,000,000 Investmentsinot 172,000,000 184,000,000 192,000,000 90,000,000 Otherinvestmen 54,000,000 38,000,000 34,000,000 32,000,000 FinancialAssets 151,000,000 94,000,000 347,000,000 757,000,000 NonCurrentAcco 7,509,000,000 8,988,000,000 9,507,000,000 10,005,000,000 NonCurrentNote Receivables NonCurrentDefe 11,690,000,000 7,654,000,000 7,892,000,000 6,399,000,000
Step by Step Solution
There are 3 Steps involved in it
Step: 1

Get Instant Access to Expert-Tailored Solutions
See step-by-step solutions with expert insights and AI powered tools for academic success
Step: 2

Step: 3

Ace Your Homework with AI
Get the answers you need in no time with our AI-driven, step-by-step assistance
Get Started


