Answered step by step
Verified Expert Solution
Question
1 Approved Answer
You have to use Excel to solve this numerical problem (project). < 1. The following data covers 24 periods (could be years, quarters, or

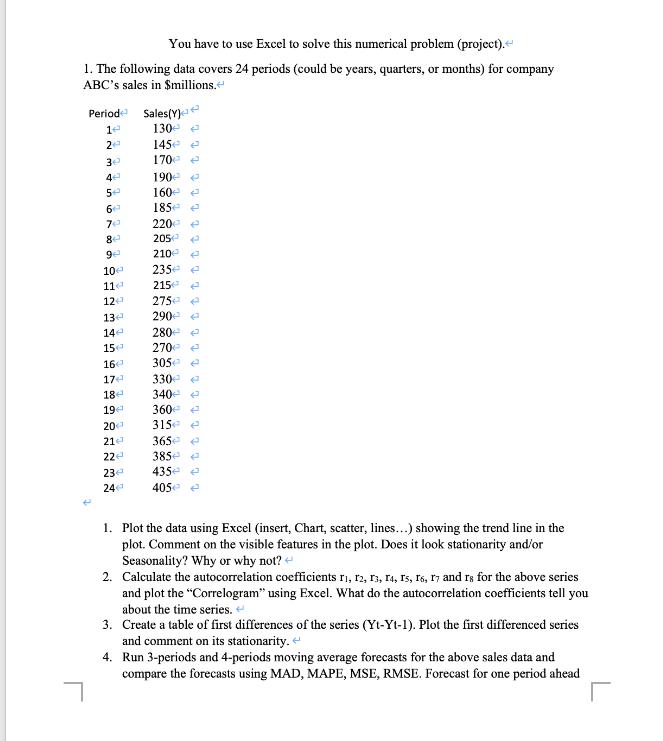
You have to use Excel to solve this numerical problem (project). < 1. The following data covers 24 periods (could be years, quarters, or months) for company ABC's sales in $millions. Period 14 2 30 4+ 5+2 6 70 802 9e 10@ 11 12 13 14@ 15 160 17 18 19 200 21 22 23 24 Sales(Y) < 130 145 170 190 160 e 185 e 2200 205 ( 210 e 235 215 275 290 280 270 3050 e 330 340 360 315 e 365 385 435 405 1. Plot the data using Excel (insert, Chart, scatter, lines...) showing the trend line in the plot. Comment on the visible features in the plot. Does it look stationarity and/or Seasonality? Why or why not? 2. Calculate the autocorrelation coefficients 11, 12, 13, 14, 15, 16, 17 and rs for the above series and plot the "Correlogram" using Excel. What do the autocorrelation coefficients tell you about the time series. 3. Create a table of first differences of the series (Yt-Yt-1). Plot the first differenced series and comment on its stationarity. 4. Run 3-periods and 4-periods moving average forecasts for the above sales data and compare the forecasts using MAD, MAPE, MSE, RMSE. Forecast for one period ahead r
Step by Step Solution
★★★★★
3.41 Rating (154 Votes )
There are 3 Steps involved in it
Step: 1

Get Instant Access to Expert-Tailored Solutions
See step-by-step solutions with expert insights and AI powered tools for academic success
Step: 2

Step: 3

Ace Your Homework with AI
Get the answers you need in no time with our AI-driven, step-by-step assistance
Get Started


