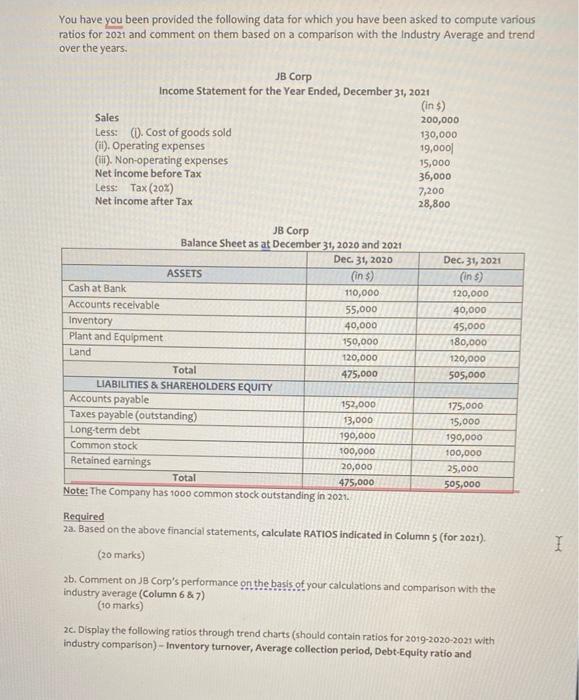
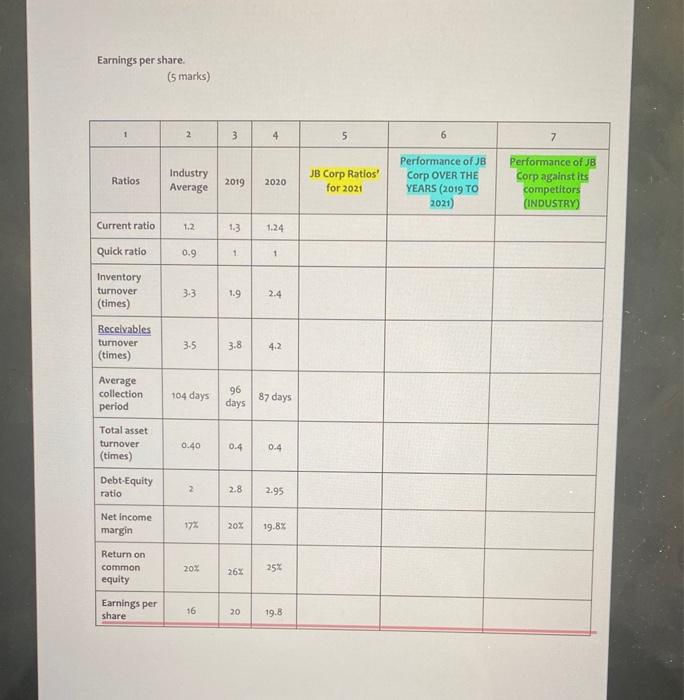
You have you been provided the following data for which you have been asked to compute various ratios for 2021 and comment on them based on a comparison with the Industry Average and trend over the years. JB Corp Income Statement for the Year Ended, December 31, 2021 (in $) Sales 200,000 Less: (O). Cost of goods sold 130,000 (it). Operating expenses 19,000 (11). Non-operating expenses Net income before Tax 36,000 Less: Tax (20%) 7,200 Net Income after Tax 28,800 15,000 JB Corp Balance Sheet as at December 31, 2020 and 2021 Dec 31, 2020 Dec 31, 2021 ASSETS (in ) (in ) Cash at Bank 110,000 120,000 Accounts receivable 55,000 40,000 Inventory 40,000 45,000 Plant and Equipment 150,000 180,000 Land 120,000 120,000 Total 475,000 505,000 LIABILITIES & SHAREHOLDERS EQUITY Accounts payable 152,000 175,000 Taxes payable (outstanding) 13,000 15,000 Long-term debt 190,000 190,000 Common stock 100,000 100,000 Retained earnings 20,000 25,000 Total 475,000 505,000 Note: The Company has 1000 common stock outstanding in 2021 Required za. Based on the above financial statements, calculate RATIOS indicated in Column 5 (for 2021). (20 marks) 2b. Comment on JB Corp's performance on the basis of your calculations and comparison with the industry average (Column 6 & 7) (10 marks) 20. Display the following ratios through trend charts (should contain ratios for 2019-2020-2021 with industry comparison) - Inventory turnover, Average collection period, Debt-Equity ratio and I I Earnings per share (5 marks) 2 3 4 5 6 7 Ratios Industry Average 2019 2020 JB Corp Ratios' for 2021 Performance of JB Corp OVER THE YEARS (2019 TO 2021) Performance of JB Corp against its competitors (INDUSTRY Current ratio 1.2 1.3 1.24 0.9 1 Quick ratio Inventory turnover (times) . 33 1.9 2.4 3.5 3.8 4.2 Receivables turnover (times) Average collection period 104 days 96 days 87 days 0.40 0.4 0.4 Total asset turnover (times) Debt-Equity ratio 2 2 2.8 2.95 Net Income margin 172 20% 19.8% Return on common equity 20% 26% 25% Earnings per share 16 20 19.8 You have you been provided the following data for which you have been asked to compute various ratios for 2021 and comment on them based on a comparison with the Industry Average and trend over the years. JB Corp Income Statement for the Year Ended, December 31, 2021 (in $) Sales 200,000 Less: (O). Cost of goods sold 130,000 (it). Operating expenses 19,000 (11). Non-operating expenses Net income before Tax 36,000 Less: Tax (20%) 7,200 Net Income after Tax 28,800 15,000 JB Corp Balance Sheet as at December 31, 2020 and 2021 Dec 31, 2020 Dec 31, 2021 ASSETS (in ) (in ) Cash at Bank 110,000 120,000 Accounts receivable 55,000 40,000 Inventory 40,000 45,000 Plant and Equipment 150,000 180,000 Land 120,000 120,000 Total 475,000 505,000 LIABILITIES & SHAREHOLDERS EQUITY Accounts payable 152,000 175,000 Taxes payable (outstanding) 13,000 15,000 Long-term debt 190,000 190,000 Common stock 100,000 100,000 Retained earnings 20,000 25,000 Total 475,000 505,000 Note: The Company has 1000 common stock outstanding in 2021 Required za. Based on the above financial statements, calculate RATIOS indicated in Column 5 (for 2021). (20 marks) 2b. Comment on JB Corp's performance on the basis of your calculations and comparison with the industry average (Column 6 & 7) (10 marks) 20. Display the following ratios through trend charts (should contain ratios for 2019-2020-2021 with industry comparison) - Inventory turnover, Average collection period, Debt-Equity ratio and I I Earnings per share (5 marks) 2 3 4 5 6 7 Ratios Industry Average 2019 2020 JB Corp Ratios' for 2021 Performance of JB Corp OVER THE YEARS (2019 TO 2021) Performance of JB Corp against its competitors (INDUSTRY Current ratio 1.2 1.3 1.24 0.9 1 Quick ratio Inventory turnover (times) . 33 1.9 2.4 3.5 3.8 4.2 Receivables turnover (times) Average collection period 104 days 96 days 87 days 0.40 0.4 0.4 Total asset turnover (times) Debt-Equity ratio 2 2 2.8 2.95 Net Income margin 172 20% 19.8% Return on common equity 20% 26% 25% Earnings per share 16 20 19.8