Question
You just graduated from a university renowned for its rigorous finance courses and recently landed a job as a corporate finance analyst for Designer Furnitures
You just graduated from a university renowned for its rigorous finance courses and recently landed a job as a corporate finance analyst for Designer Furnitures (DF) Ltd, a company that deals primarily in furniture retail and interior design.
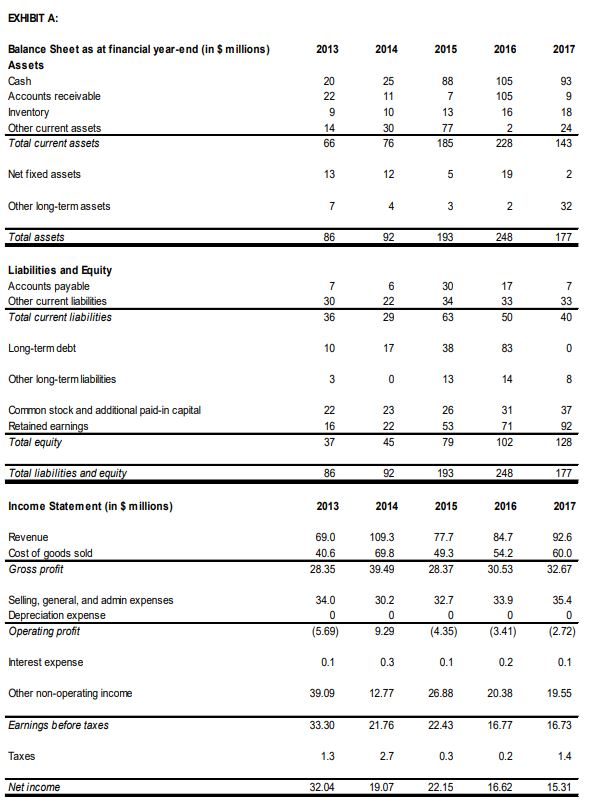
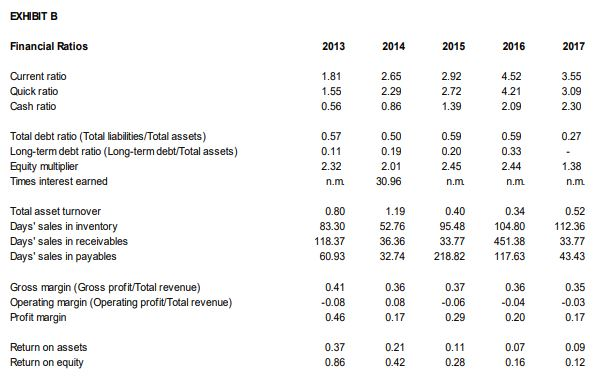
KK Poon, one of the two co-founders of the company, is concerned about the threat that online retailing has posed to the company and has tasked you to look into the companys financial health and operating performance. You extract the companys historical balance sheet and income statement information (Exhibit A) and work out some preliminary ratios (Exhibit B).
In light of the current trends, DF Ltd is exploring two potential e-business opportunities. The first opportunity (Project A) is to develop an online retail presence as an additional channel to distribute their furniture while the second (Project B) is to provide a subscription service for crowd-sourced interior design ideas. Unfortunately, the window of opportunity is closing on both of these opportunities and DF Ltd can only capitalise on one of them.
KK Poon needs your help with this second task and shows you the three-year revenue projections for both opportunities (he insists any crystal ball is too foggy beyond 3 years):
| Revenue (In $ millions) | |||
| Year | 1 | 2 | 3 |
| Project A | 3 | 8 | 12 |
| Project B | 8 | 6 | 3 |
He also mentions that variable cost is 60% of sales for the first project and 30% of sales for the second, with respective annual fixed cash costs of $2m and $4m. As these are web-based projects, the hardware and software solutions can be leased as needed, so there is no capital expenditure required and working capital requirements are minimal.
DF Ltd currently has 200 million shares priced at $0.50 each and no debt. KK Poon, however, is considering issuing, and rolling over indefinitely, 20,000 3% annual-coupon, ten-year bonds with a face value of $1,000 each. The bonds will be issued at a price of $900 each and the bond proceeds will then be used to repurchase shares. KK Poon tells you that the yield on these bonds is either 2.75% or 4.25% but refuses to tell you which number is correct. As you nervously pop candies into your mouth from a bag that reads melts in your hands, not in your mouth, KK Poon tasks you to think through the implications of this capital restructuring.
You figure you will need some equity information as well. Your research reveals that DF Ltds beta is 0.7 and an all-equity online information service provider with a subscription-based revenue model has a beta of 0.3. Based on historical performance, you expect the stock market to have a 10% annual return.
In your quest, you also find out that the promised return on the deposit account of a local bank is 2% per annum whereas the annual yield on a 10-year government bond is 4.25%. The marginal corporate tax rate for DF Ltd is 20%.
As a final task, you are roped in for next years cash budgeting exercise. Furniture is typically purchased a quarter prior to its sale at 60% of the revenue. The forecasted revenue for the coming quarters is as follows:

JJ Lin, the other co-founder of the company, is also the largest shareholder of the company with his 50.01% ownership stake. Although he has recently retired, he still spends a significant amount of time bickering with KK Poon on the appropriate direction in which to take the company. The rest of his time is spent living it up, realising only recently that his financial resources are running dangerously low. DF Ltd has never paid a dividend, however. When you met JJ Lin, who invited you to one of his yacht parties, he mentioned that he is considering the use of homemade dividendsinstead of needing DF Ltd to pay a dividend, he can sell some shares to effectively create a dividend in years when he would like one. JJ Lin is a resident in a tax regime where dividends are taxed more than capital gains.


(a) Based on the information in Exhibits A and B, evaluate and assess DF Ltds financial health and operating performance. (15 marks)
(b) Without calculating, is it possible to infer the yield-to-maturity on DF Ltds bonds? If so, appraise fully how. If not, appraise fully why not. (5 marks)
(c) Discuss and explain whether firm value and equity value will increase, decrease, or remain unchanged by the proposed capital restructuring. (5 marks)
(d) Identify and discuss the key considerations when determining a suitable cost(s) of equity for the projects. (10 marks)
(e) Synthesize your ideas from parts (b) through (d) to derive an appropriate estimation of a discount rate for Project B. State any assumptions used. (15 marks)
(f) Compare the suitability of the NPV and IRR approaches for evaluating the two (2) projects and evaluate which of the two projects DF Ltd should pursue. KK Poon throws you a bone and asks you to use 7.96% as a discount rate for Project A. (20 marks)
(g) Prepare and construct a cash budget for DF Ltd. (20 marks)
(h) Critically evaluate JJ Lins idea of using homemade dividends. (10 marks)
Revenue (in $ millions) 2018 Q2 Q3 24 18.79 18.75 38.37 Q1 19.09 2019 21 18.16 EXHIBIT A: 2017 Balance Sheet as at financial year-end (in $ millions) Assets Cash Accounts receivable Inventory Other current assets Total current assets Net fixed assets Other long-term assets Total assets 92 193 248 Liabilities and Equity Accounts payable Other current liabilities Total current liabilities Long-term debt Other long-term liabilities Common stock and additional paid-in capital Retained earnings Total equity 102 Total liabilities and equity 92 248 Income Statement (in $ millions) 2013 2014 2015 2016 2017 Revenue Cost of goods sold Gross profit 69.0 40.6 28.35 109.3 69.8 39.49 77.7 49.3 28.37 84.7 54.2 30.53 92.6 60.0 32.67 34.0 33.9 35.4 Selling, general, and admin expenses Depreciation expense Operating profit 30.2 0 9.29 0 32.7 0 (4.35) (5.69) 9.29 (435) (3.41) Interest expense 0.3 Other non-operating income 1277 0.1 26.88 22.43 0.3 39.09 33.30 13 Earnings before taxes 21.76 27 20.38 16.77 0.2 19.55 16.73 1.4 Taxes Net income 32.04 19.07 22.15 16.62 15.31 EXHIBIT B Financial Ratios 2013 2014 2015 2016 2017 2.92 Current ratio Quick ratio Cash ratio 1.81 1.55 0.56 2.65 2.29 0.86 2.72 4.52 4.21 2.09 3.55 3.09 2.30 1.39 0.57 0.27 0.11 Total debt ratio (Total liabilities/Total assets) Long-term debt ratio (Long-term debt/Total assets) Equity multiplier Times interest earned 2.32 n.m 0.50 0.19 2.01 30.96 0.59 0.20 2.45 n.m 0.59 0.33 2.44 n.m 1.38 n.m Total asset turnover Days' sales in inventory Days' sales in receivables Days' sales in payables 0.80 83.30 118.37 60.93 1.19 52.76 36.36 32.74 0.40 95.48 33.77 218.82 0.34 104.80 451.38 117.63 0.52 112.36 33.77 43.43 Gross margin (Gross profit/Total revenue) Operating margin (Operating profit/Total revenue) Profit margin 0.41 -0.08 0.46 0.36 0.08 0.17 0.37 -0.06 0.29 0.36 -0.04 0.20 0.35 -0.03 0.17 Return on assets Return on equity 0.21 0.42 0.11 0.28 0.07 0.16 0.09 0.12 Revenue (in $ millions) 2018 Q2 Q3 24 18.79 18.75 38.37 Q1 19.09 2019 21 18.16 EXHIBIT A: 2017 Balance Sheet as at financial year-end (in $ millions) Assets Cash Accounts receivable Inventory Other current assets Total current assets Net fixed assets Other long-term assets Total assets 92 193 248 Liabilities and Equity Accounts payable Other current liabilities Total current liabilities Long-term debt Other long-term liabilities Common stock and additional paid-in capital Retained earnings Total equity 102 Total liabilities and equity 92 248 Income Statement (in $ millions) 2013 2014 2015 2016 2017 Revenue Cost of goods sold Gross profit 69.0 40.6 28.35 109.3 69.8 39.49 77.7 49.3 28.37 84.7 54.2 30.53 92.6 60.0 32.67 34.0 33.9 35.4 Selling, general, and admin expenses Depreciation expense Operating profit 30.2 0 9.29 0 32.7 0 (4.35) (5.69) 9.29 (435) (3.41) Interest expense 0.3 Other non-operating income 1277 0.1 26.88 22.43 0.3 39.09 33.30 13 Earnings before taxes 21.76 27 20.38 16.77 0.2 19.55 16.73 1.4 Taxes Net income 32.04 19.07 22.15 16.62 15.31 EXHIBIT B Financial Ratios 2013 2014 2015 2016 2017 2.92 Current ratio Quick ratio Cash ratio 1.81 1.55 0.56 2.65 2.29 0.86 2.72 4.52 4.21 2.09 3.55 3.09 2.30 1.39 0.57 0.27 0.11 Total debt ratio (Total liabilities/Total assets) Long-term debt ratio (Long-term debt/Total assets) Equity multiplier Times interest earned 2.32 n.m 0.50 0.19 2.01 30.96 0.59 0.20 2.45 n.m 0.59 0.33 2.44 n.m 1.38 n.m Total asset turnover Days' sales in inventory Days' sales in receivables Days' sales in payables 0.80 83.30 118.37 60.93 1.19 52.76 36.36 32.74 0.40 95.48 33.77 218.82 0.34 104.80 451.38 117.63 0.52 112.36 33.77 43.43 Gross margin (Gross profit/Total revenue) Operating margin (Operating profit/Total revenue) Profit margin 0.41 -0.08 0.46 0.36 0.08 0.17 0.37 -0.06 0.29 0.36 -0.04 0.20 0.35 -0.03 0.17 Return on assets Return on equity 0.21 0.42 0.11 0.28 0.07 0.16 0.09 0.12Step by Step Solution
There are 3 Steps involved in it
Step: 1

Get Instant Access to Expert-Tailored Solutions
See step-by-step solutions with expert insights and AI powered tools for academic success
Step: 2

Step: 3

Ace Your Homework with AI
Get the answers you need in no time with our AI-driven, step-by-step assistance
Get Started


