Question
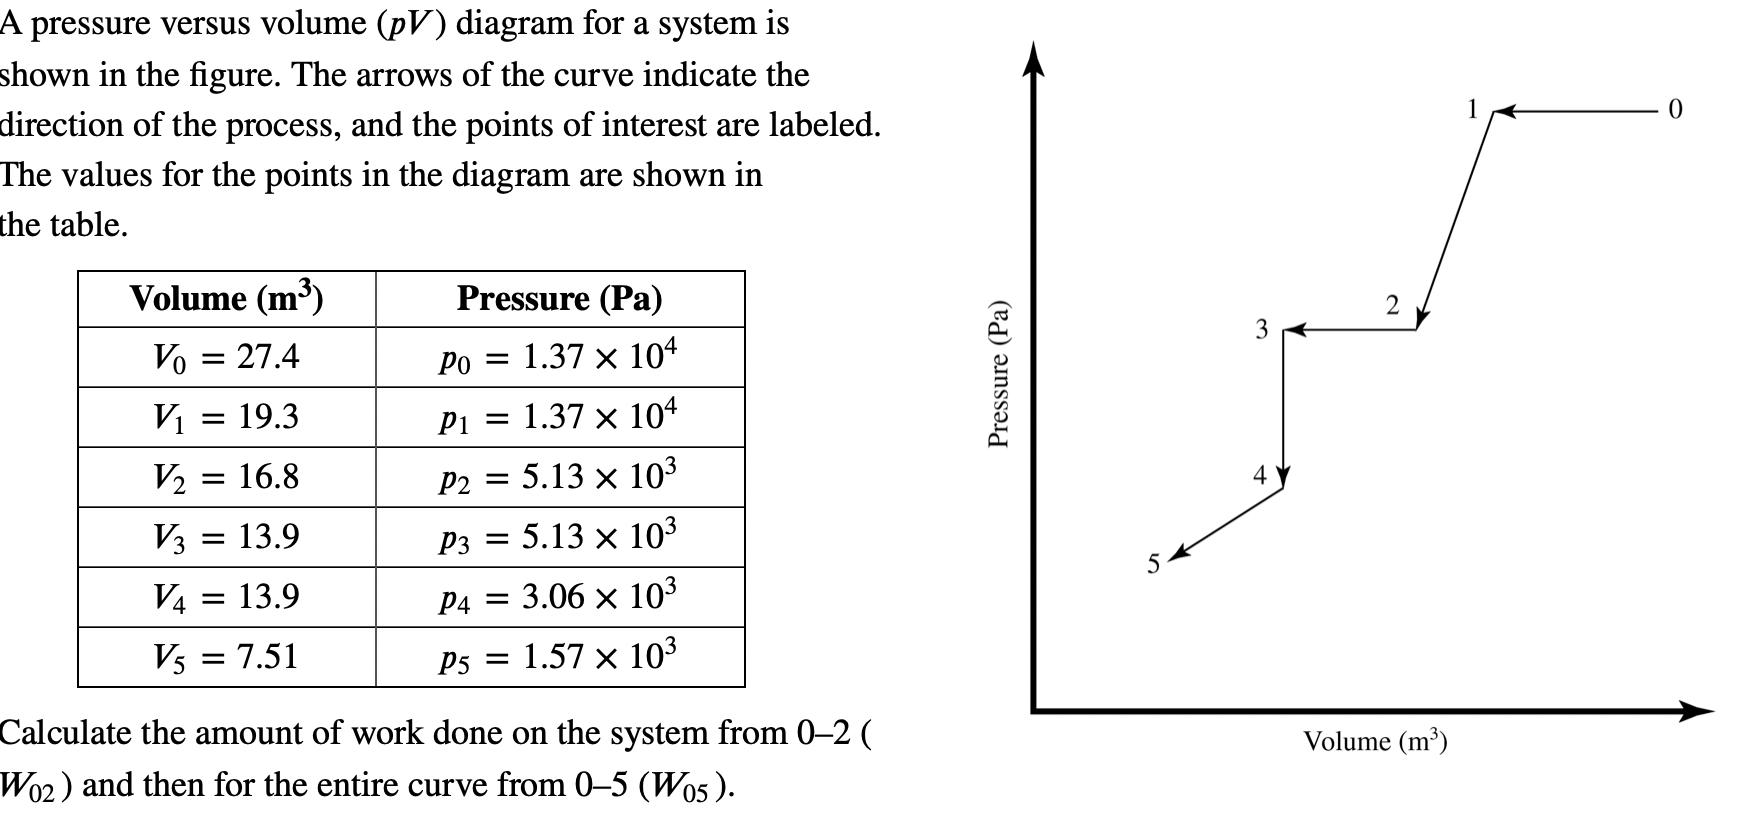
A pressure versus volume (pV) diagram for a system is shown in the figure. The arrows of the curve indicate the direction of the

A pressure versus volume (pV) diagram for a system is shown in the figure. The arrows of the curve indicate the direction of the process, and the points of interest are labeled. The values for the points in the diagram are shown in the table. Volume (m) Vo = 27.4 V = 19.3 V = 16.8 V3 = 13.9 V4 = 13.9 V5 = 7.51 Pressure (Pa) Po = 1.37 104 P1 = 1.37 104 P2 = 5.13 x 10 P3 = 5.13 x 10 P4 = 3.06 x 10 P5 = 1.57 x 10³ Calculate the amount of work done on the system from 0-2 ( W02) and then for the entire curve from 0-5 (W05). Pressure (Pa) 3 4 2 Volume (m)
Step by Step Solution
3.39 Rating (149 Votes )
There are 3 Steps involved in it
Step: 1
As we know that Amount of work done for 3 0 2 W 13700 274193 13...
Get Instant Access to Expert-Tailored Solutions
See step-by-step solutions with expert insights and AI powered tools for academic success
Step: 2

Step: 3

Ace Your Homework with AI
Get the answers you need in no time with our AI-driven, step-by-step assistance
Get StartedRecommended Textbook for
Macroeconomics
Authors: David Colander
8th edition
978-0078004407, 78004403, 978-0077247171, 77247175, 978-0077307110
Students also viewed these Physics questions
Question
Answered: 1 week ago
Question
Answered: 1 week ago
Question
Answered: 1 week ago
Question
Answered: 1 week ago
Question
Answered: 1 week ago
Question
Answered: 1 week ago
Question
Answered: 1 week ago
Question
Answered: 1 week ago
Question
Answered: 1 week ago
Question
Answered: 1 week ago
Question
Answered: 1 week ago
Question
Answered: 1 week ago
Question
Answered: 1 week ago
Question
Answered: 1 week ago
Question
Answered: 1 week ago
Question
Answered: 1 week ago
Question
Answered: 1 week ago
Question
Answered: 1 week ago
Question
Answered: 1 week ago
Question
Answered: 1 week ago
Question
Answered: 1 week ago
View Answer in SolutionInn App


