

Answered step by step
Verified Expert Solution
Question
1 Approved Answer
You like pizza and you like cola. Which of the graphs in the figure below represents your happiness has a function of how many
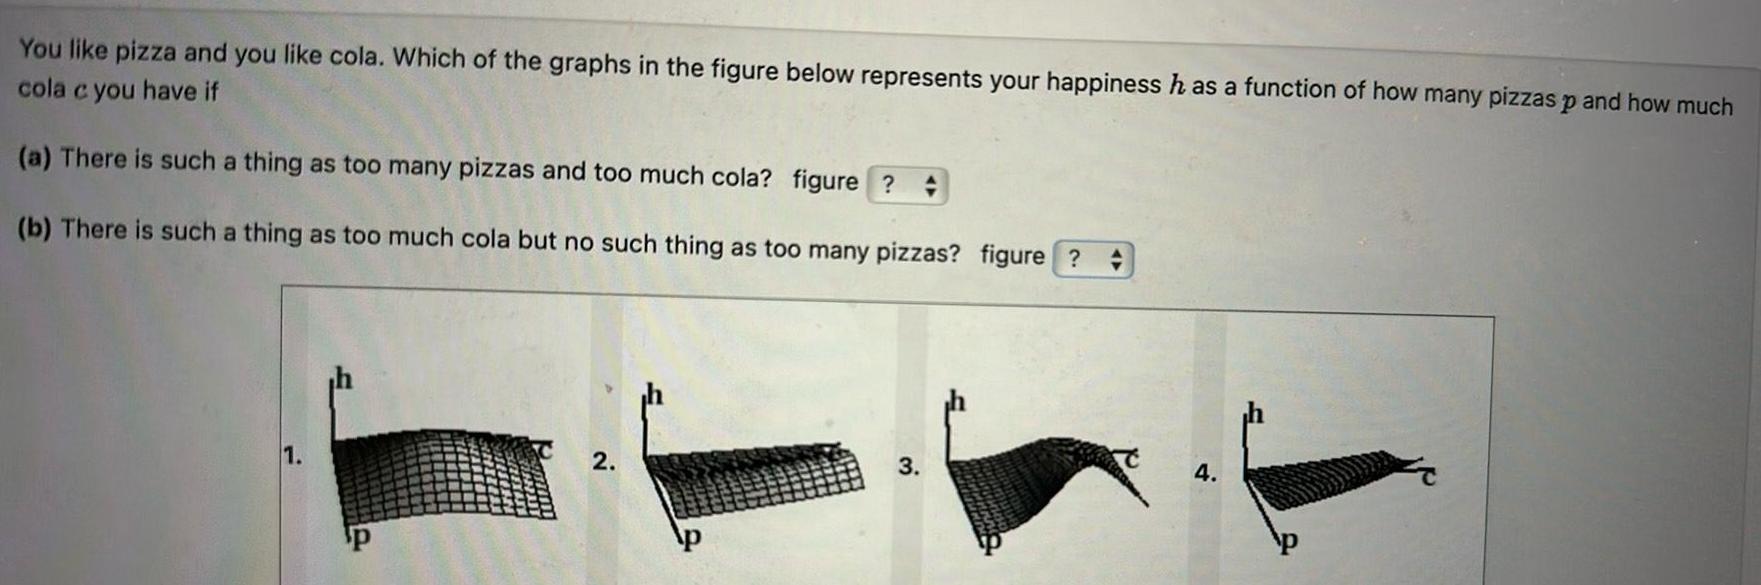
You like pizza and you like cola. Which of the graphs in the figure below represents your happiness has a function of how many pizzas p and how much cola c you have if (a) There is such a thing as too many pizzas and too much cola? figure ? (b) There is such a thing as too much cola but no such thing as too many pizzas? figure ? 1. p C 2. p 3. 4. P
Step by Step Solution
There are 3 Steps involved in it
Step: 1

Get Instant Access to Expert-Tailored Solutions
See step-by-step solutions with expert insights and AI powered tools for academic success
Step: 2

Step: 3
Ace Your Homework with AI
Get the answers you need in no time with our AI-driven, step-by-step assistance
Get Started
Introduction To Management Science
Authors: Bernard W. Taylor
12th Edition
1292092912, 9781292092911