Question
Based on the following data, conduct a Monte Carlo simulation with at least 100 realizations to find the distribution in NPV for the following

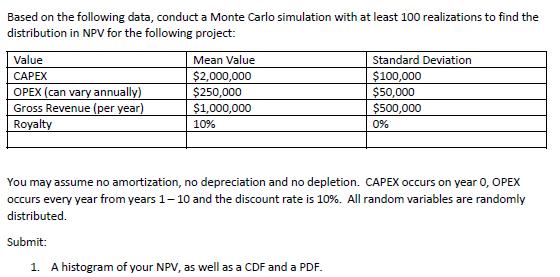
Based on the following data, conduct a Monte Carlo simulation with at least 100 realizations to find the distribution in NPV for the following project: Value Mean Value Standard Deviation $2,000,000 $250,000 $100,000 $50,000 $500,000 E OPEX (can vary annually) Gross Revenue (per year) $1,000,000 Royalty 10% 0% You may assume no amortization, no depreciation and no depletion. CAPEX occurs on year 0, OPEX occurs every year from years 1-10 and the discount rate is 10%. All random variables are randomly distributed. Submit: 1. A histogram of your NP, as well as a CDF and a PDF.
Step by Step Solution
3.51 Rating (161 Votes )
There are 3 Steps involved in it
Step: 1

Get Instant Access to Expert-Tailored Solutions
See step-by-step solutions with expert insights and AI powered tools for academic success
Step: 2

Step: 3

Ace Your Homework with AI
Get the answers you need in no time with our AI-driven, step-by-step assistance
Get StartedRecommended Textbook for
Money Banking and Financial Markets
Authors: Laurence M. Ball
2nd edition
1429244097, 978-1429244091
Students also viewed these Finance questions
Question
Answered: 1 week ago
Question
Answered: 1 week ago
Question
Answered: 1 week ago
Question
Answered: 1 week ago
Question
Answered: 1 week ago
Question
Answered: 1 week ago
Question
Answered: 1 week ago
Question
Answered: 1 week ago
Question
Answered: 1 week ago
Question
Answered: 1 week ago
Question
Answered: 1 week ago
Question
Answered: 1 week ago
Question
Answered: 1 week ago
Question
Answered: 1 week ago
Question
Answered: 1 week ago
Question
Answered: 1 week ago
Question
Answered: 1 week ago
Question
Answered: 1 week ago
Question
Answered: 1 week ago
Question
Answered: 1 week ago
Question
Answered: 1 week ago
Question
Answered: 1 week ago
View Answer in SolutionInn App


