Question
1. What is a 90% confidence interval for the correlation between Satisfaction and Effectiveness? 2 . Conduct a simple regression analysis with Satisfaction as your
1. What is a 90% confidence interval for the correlation between Satisfaction and Effectiveness?
2 . Conduct a simple regression analysis with Satisfaction as your dependent variable and Pain as your independent variable. Discuss what you see/observe.
3. Conduct a multiple regression analysis with both Effectiveness and Pain as your predictors. Discuss what you see/observe. Having done this, evaluate (and discuss) whether the incorporation of Sex into your model would be useful.
4. Using your “hold-out” sample, cross-validate the model you fit in Part 3. Discuss what you see/observe.
You must first create your own dataset, drawn from the table. You will use the first 160 of your observations for Parts 1, 2 and 3 of this assignment. You will use the last 40 for Part 4. These data result from a study of patient satisfaction at a network of dermatology practices. The variables are: “Patient” (once you’ve created your dataset you can ignore this one); “Sex”; “Satisfaction” (the patient’s self-reported overall satisfaction (1 to 100); “Effectiveness” (the patient’s self-reported view of the effectiveness of the procedure (1 to 80); and “Pain” (the patient’s self-reported post-procedure pain (1 to 80).
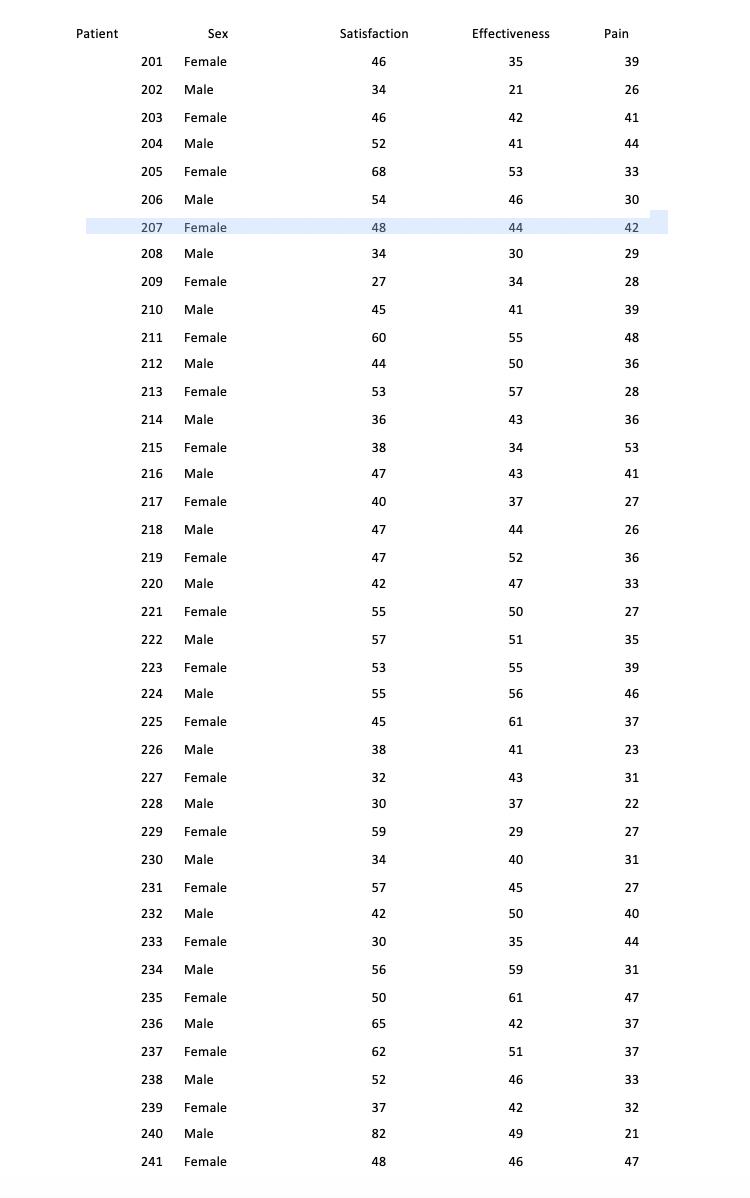
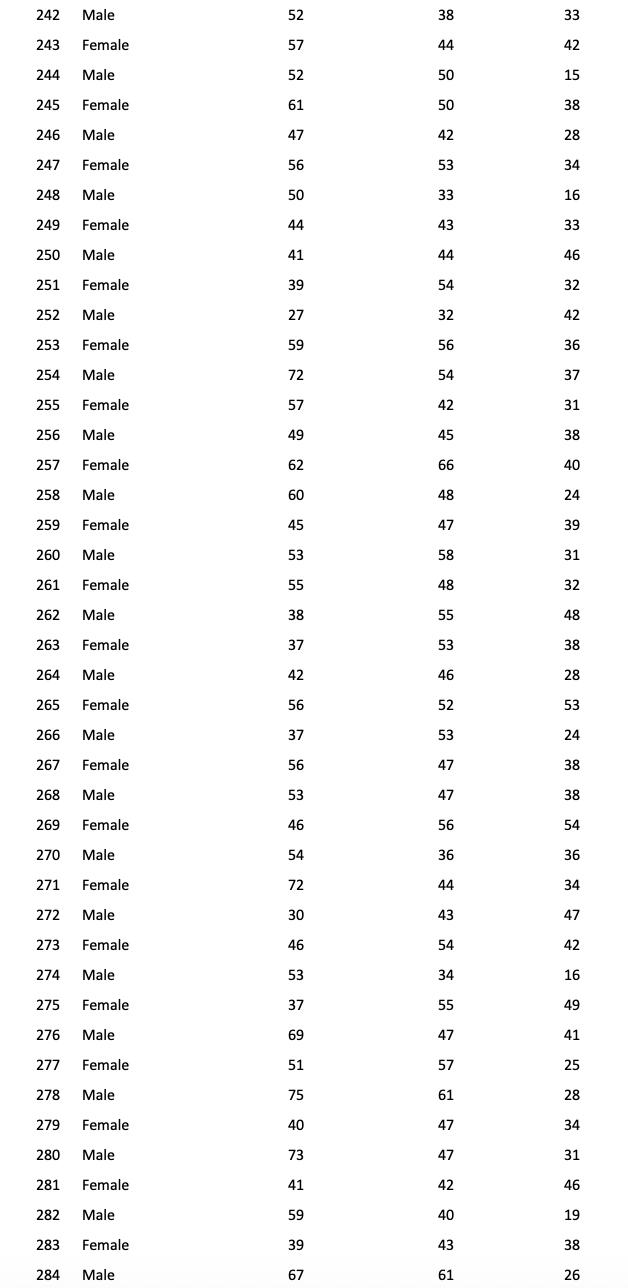
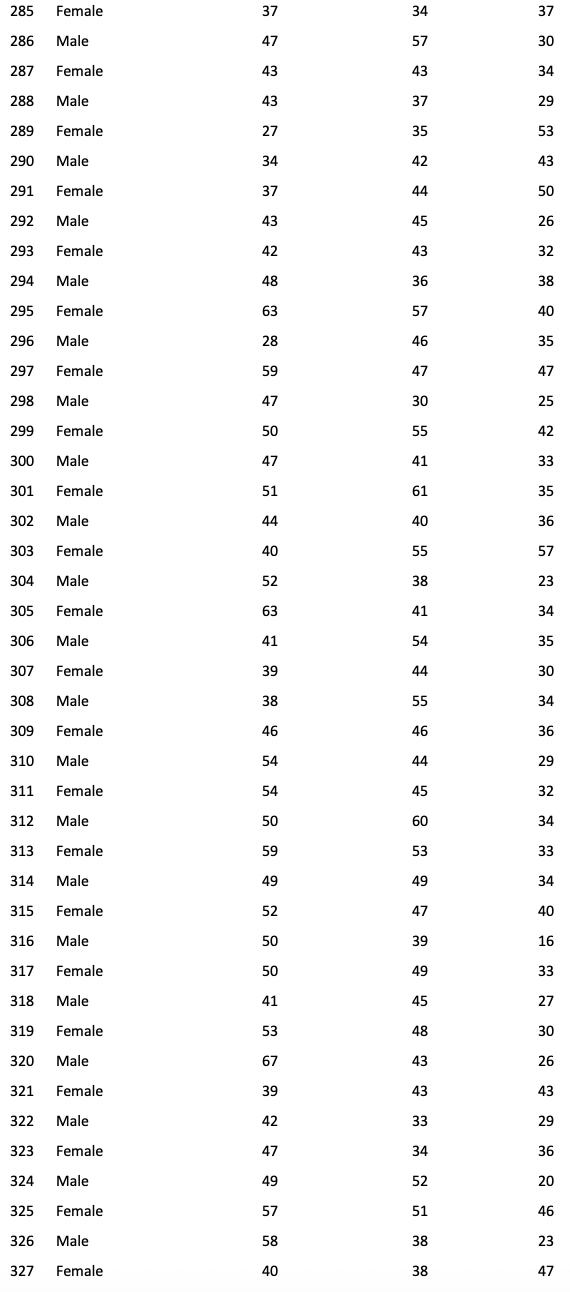
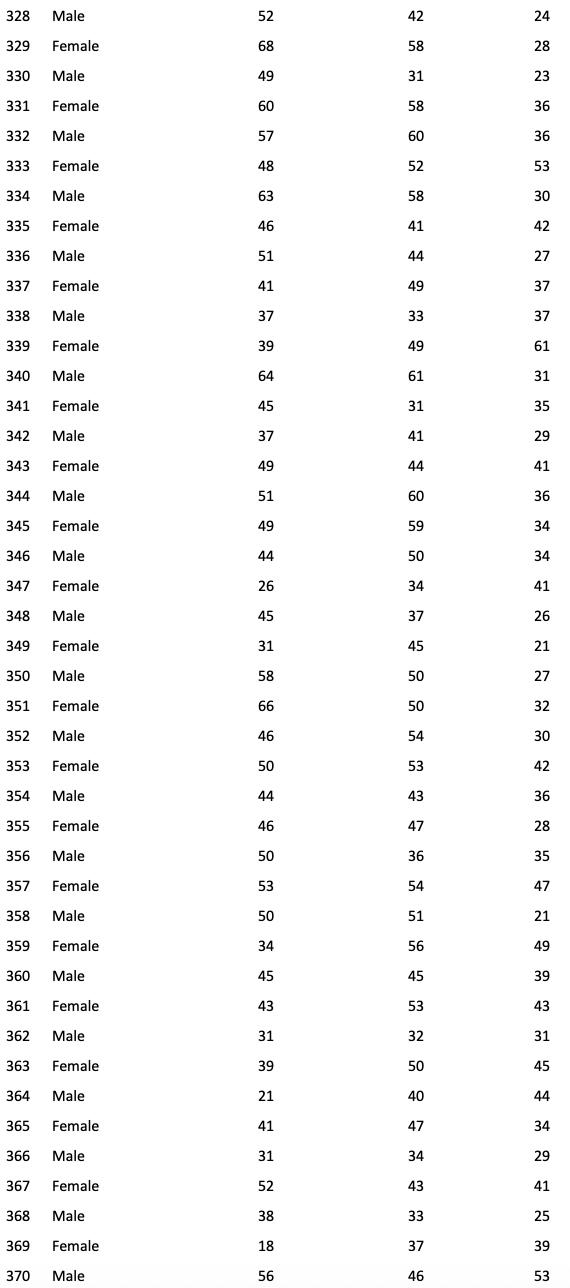
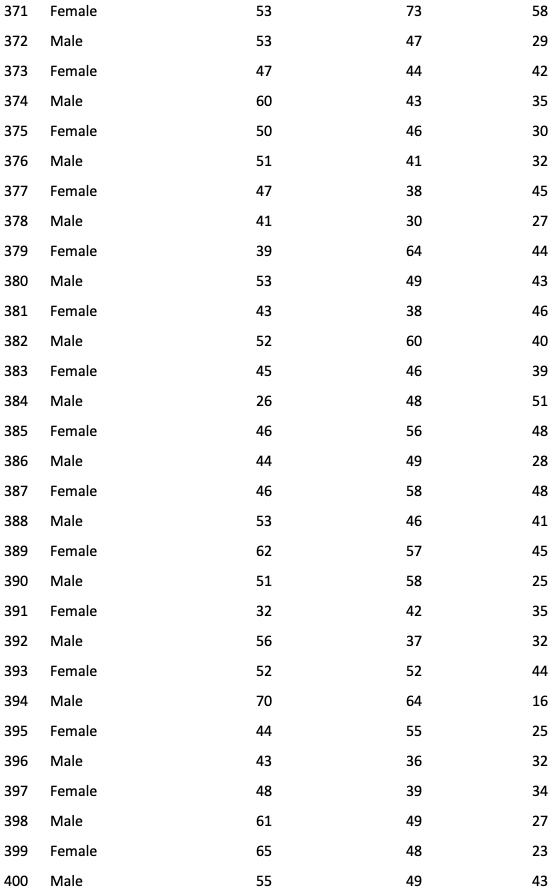
Patient Sex Satisfaction Effectiveness Pain 201 Female 46 35 39 202 Male 34 21 26 203 Female 46 42 41 204 Male 52 41 44 205 Female 68 53 33 206 Male 54 46 30 207 Female 48 44 42 208 Male 34 30 29 209 Female 27 34 28 210 Male 45 41 39 211 Female 60 55 48 212 Male 44 50 36 213 Female 53 57 28 214 Male 36 43 36 215 Female 38 34 53 216 Male 47 43 41 217 Female 40 37 27 218 Male 47 44 26 219 Female 47 52 36 220 Male 42 47 33 221 Female 55 50 27 222 Male 57 51 35 223 Female 53 55 39 224 Male 55 56 46 225 Female 45 61 37 226 Male 38 41 23 227 Female 32 43 31 228 Male 30 37 22 229 Female 59 29 27 230 Male 34 40 31 231 Female 57 45 27 232 Male 42 50 40 233 Female 30 35 44 234 Male 56 59 31 235 Female 50 61 47 236 Male 65 42 37 237 Female 62 51 37 238 Male 52 46 33 239 Female 37 42 32 240 Male 82 49 21 241 Female 48 46 47
Step by Step Solution
There are 3 Steps involved in it
Step: 1
Number of observations given n152 1Correaltion coeficient between Satisfaction and effectiveness 04081 Formula of Confidance interval The lower and up...
Get Instant Access to Expert-Tailored Solutions
See step-by-step solutions with expert insights and AI powered tools for academic success
Step: 2

Step: 3

Ace Your Homework with AI
Get the answers you need in no time with our AI-driven, step-by-step assistance
Get Started


