

Answered step by step
Verified Expert Solution
Question
1 Approved Answer
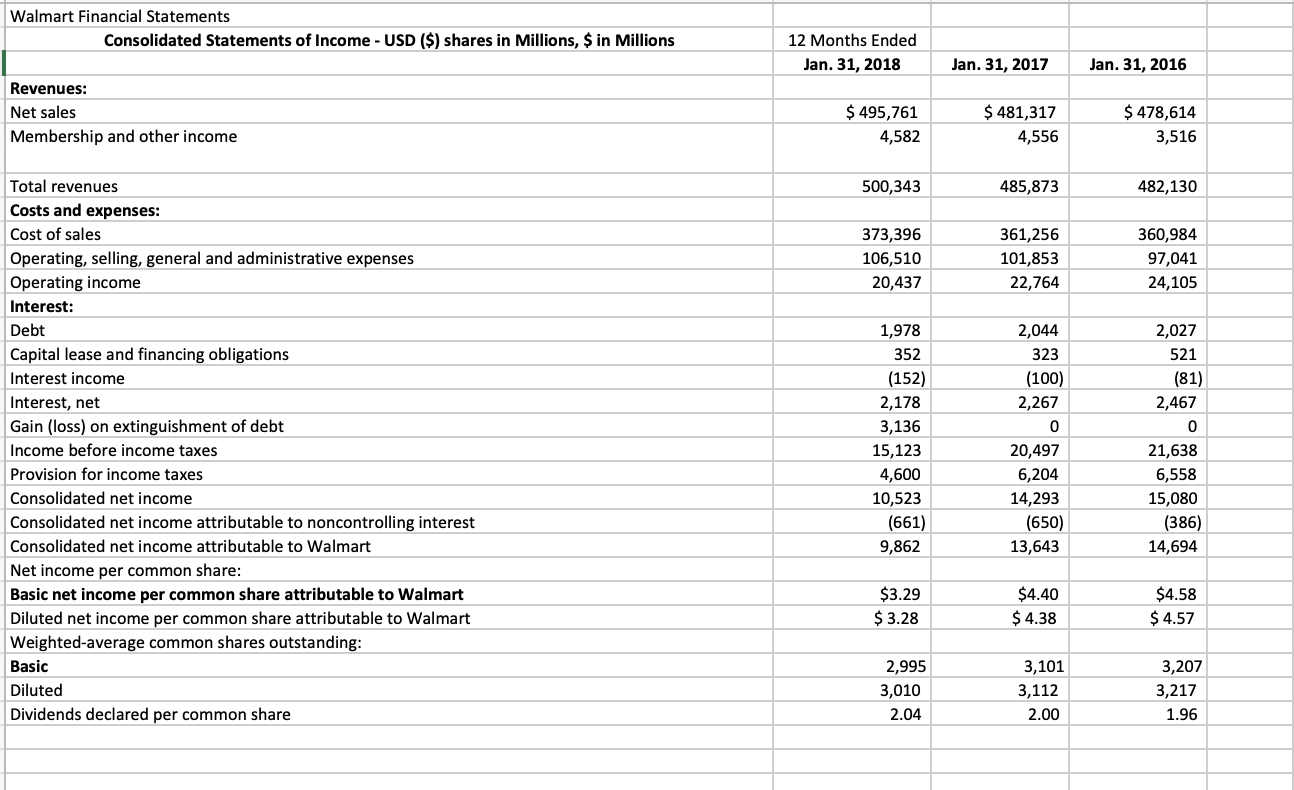
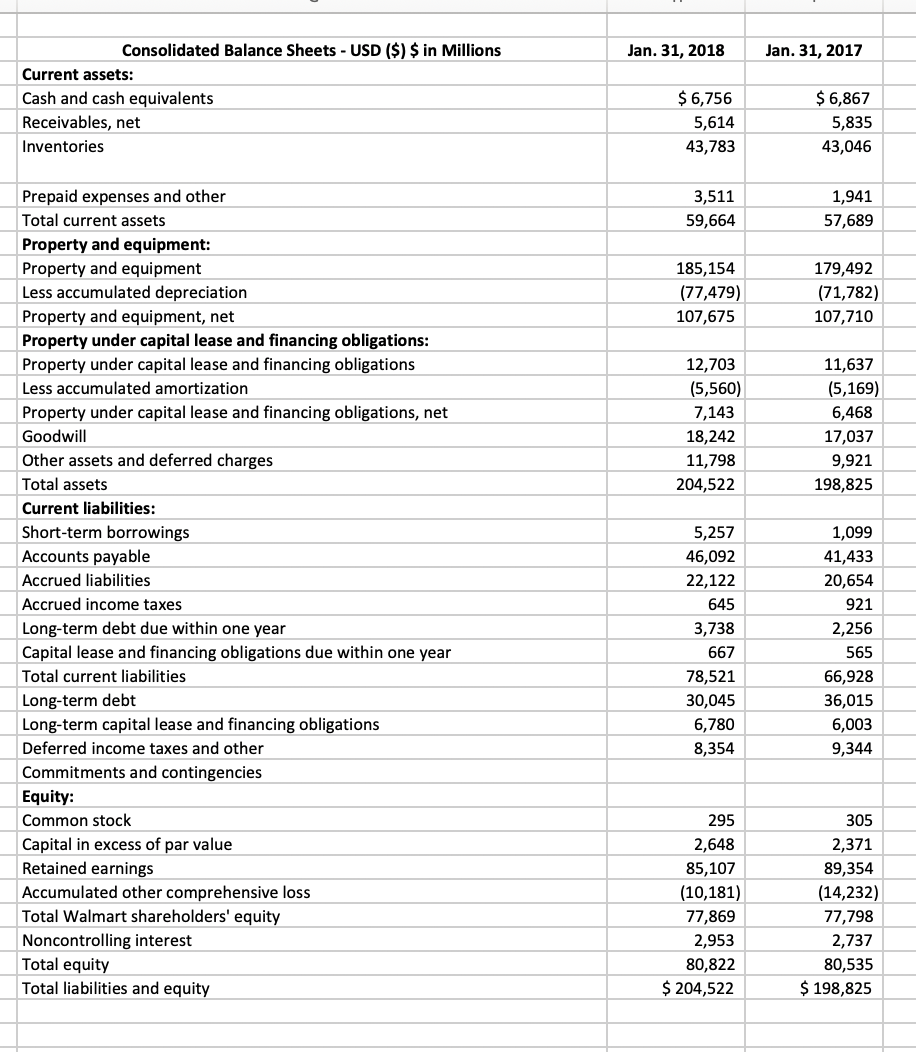
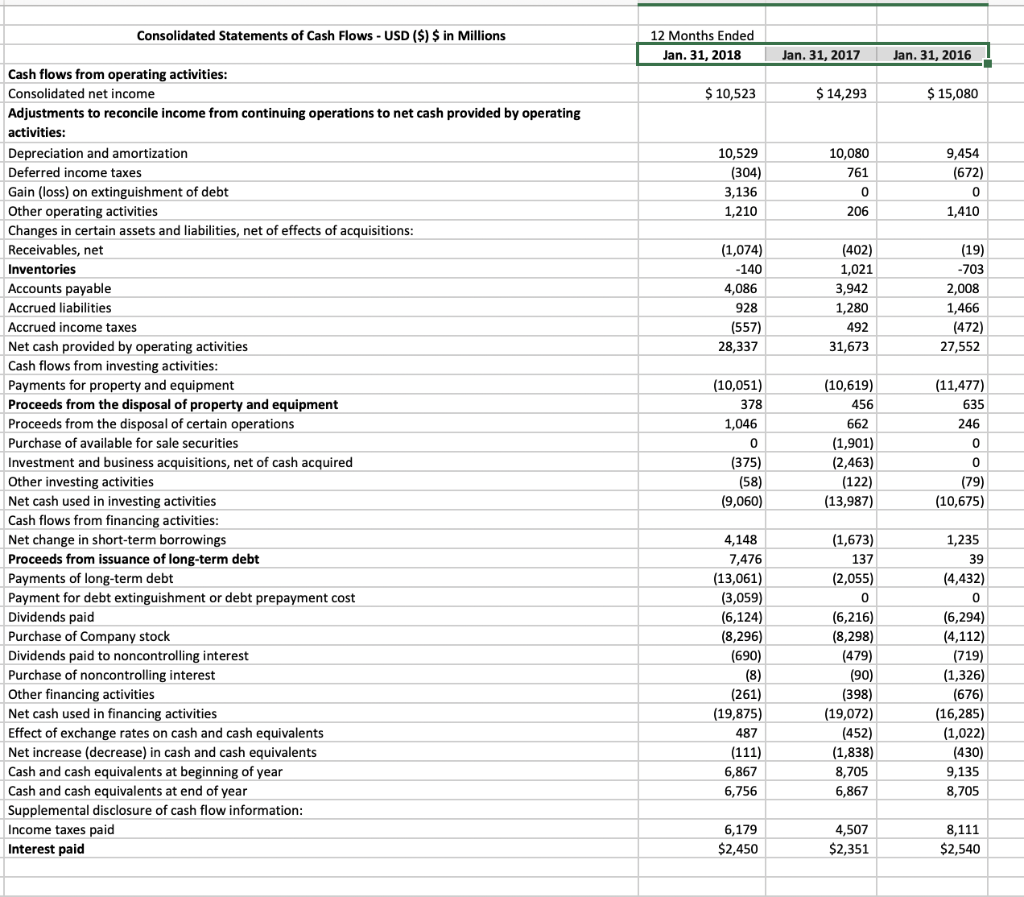
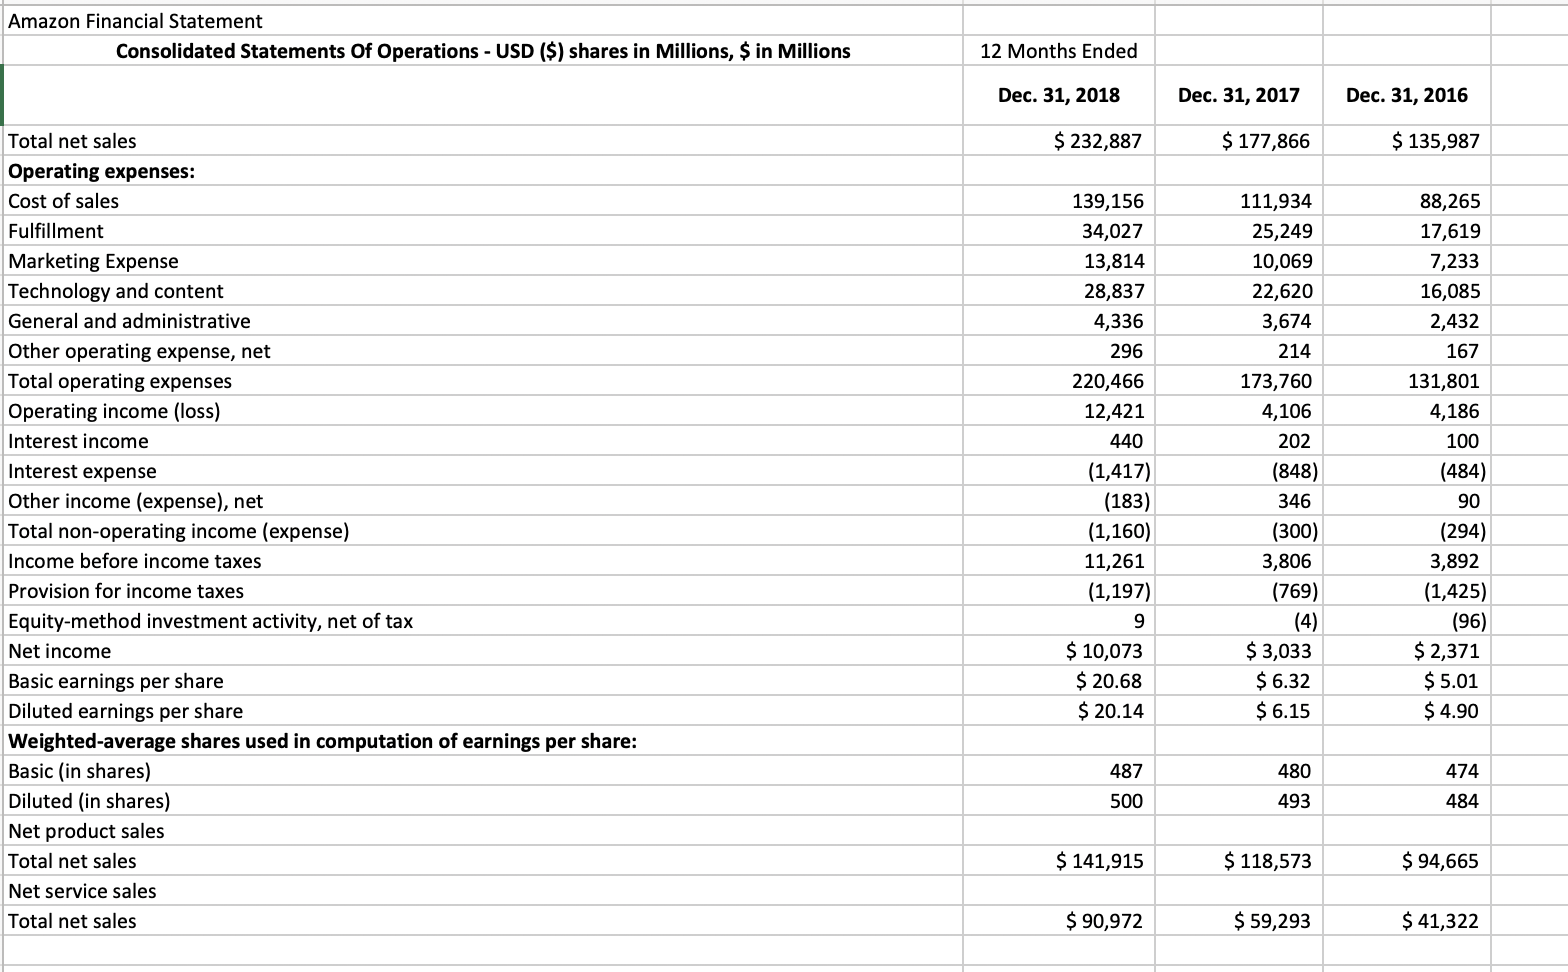
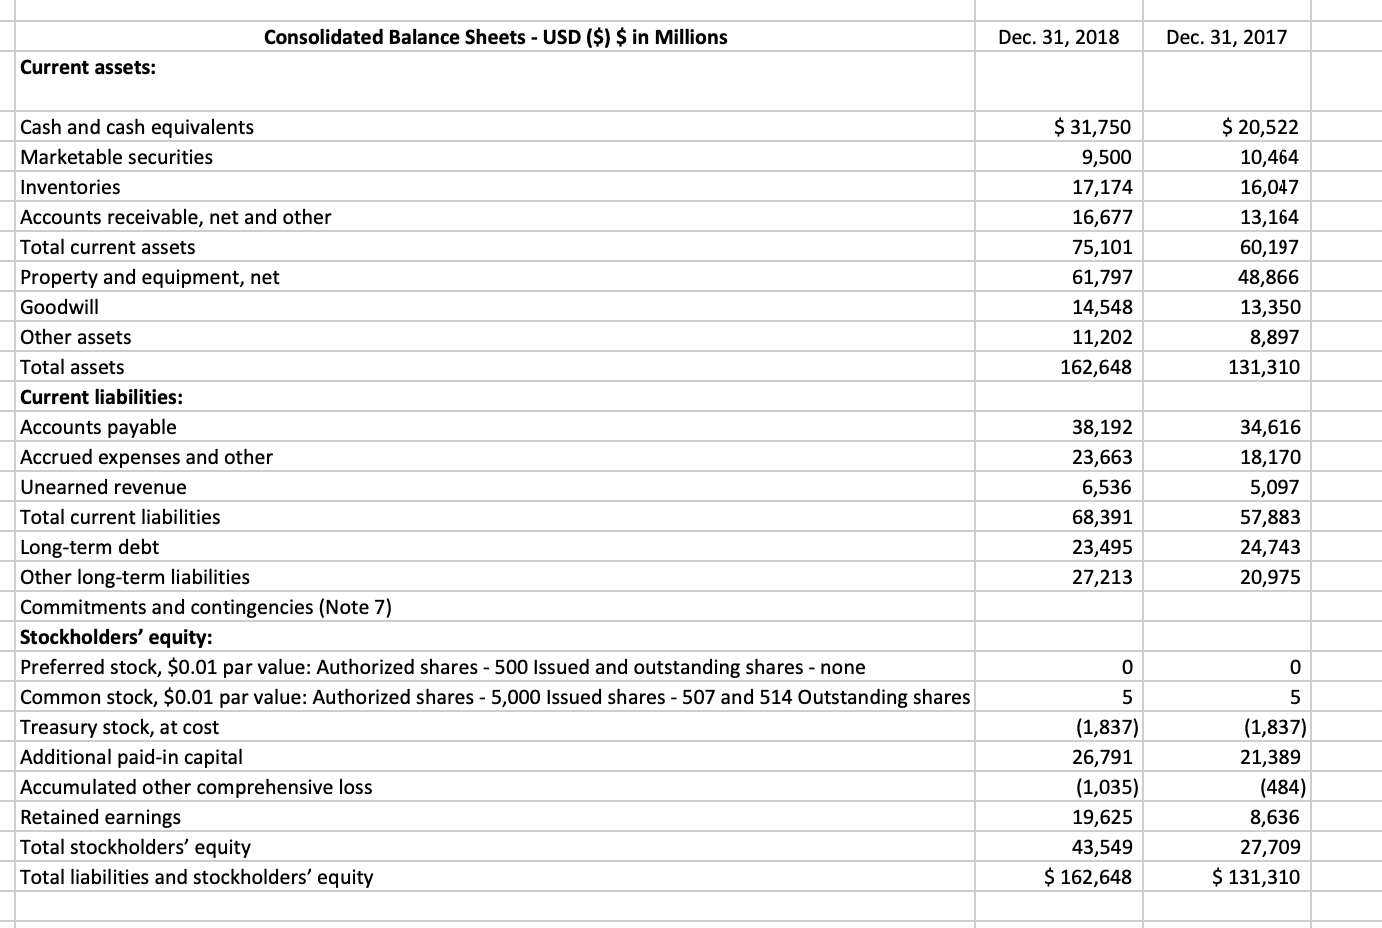
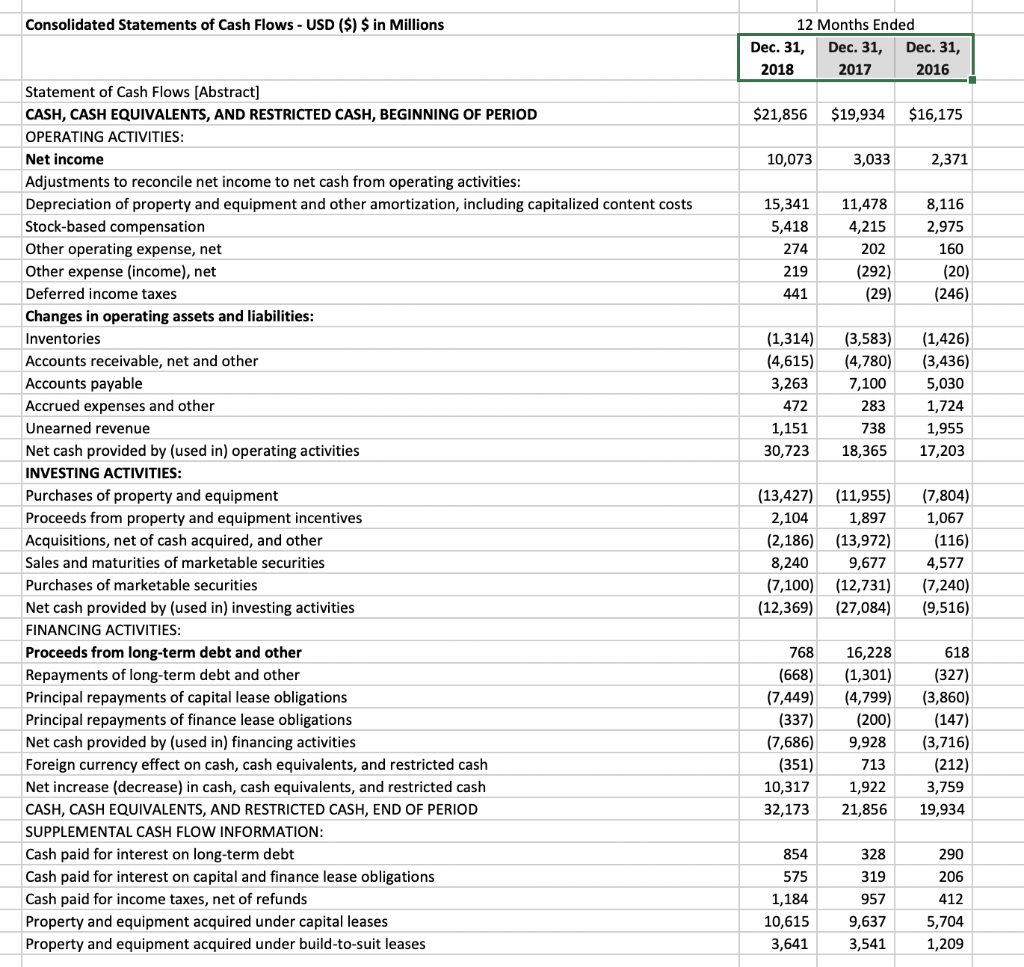
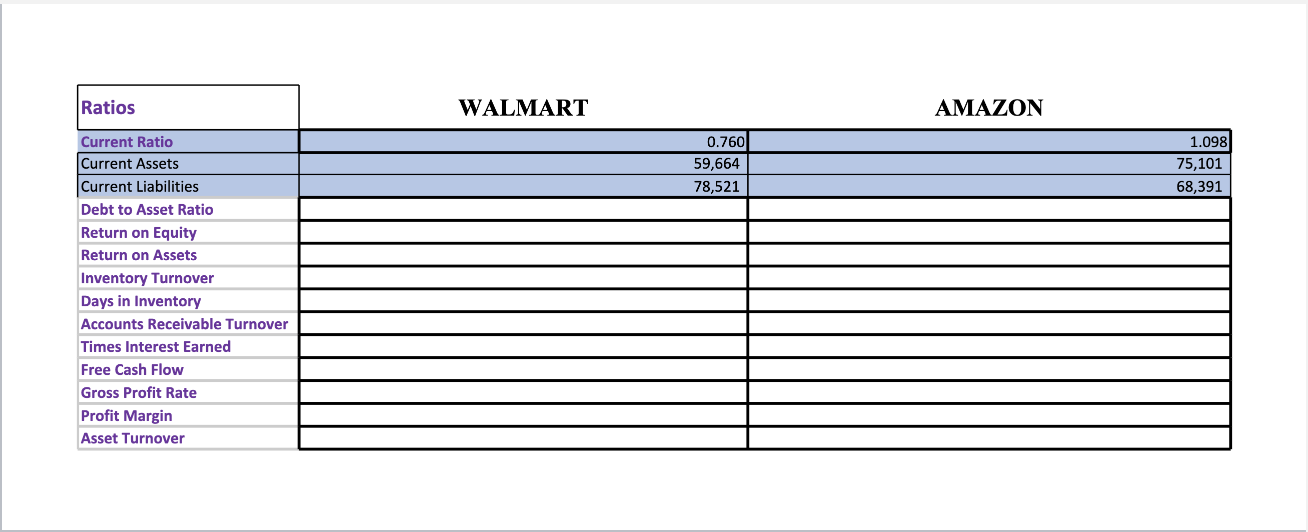
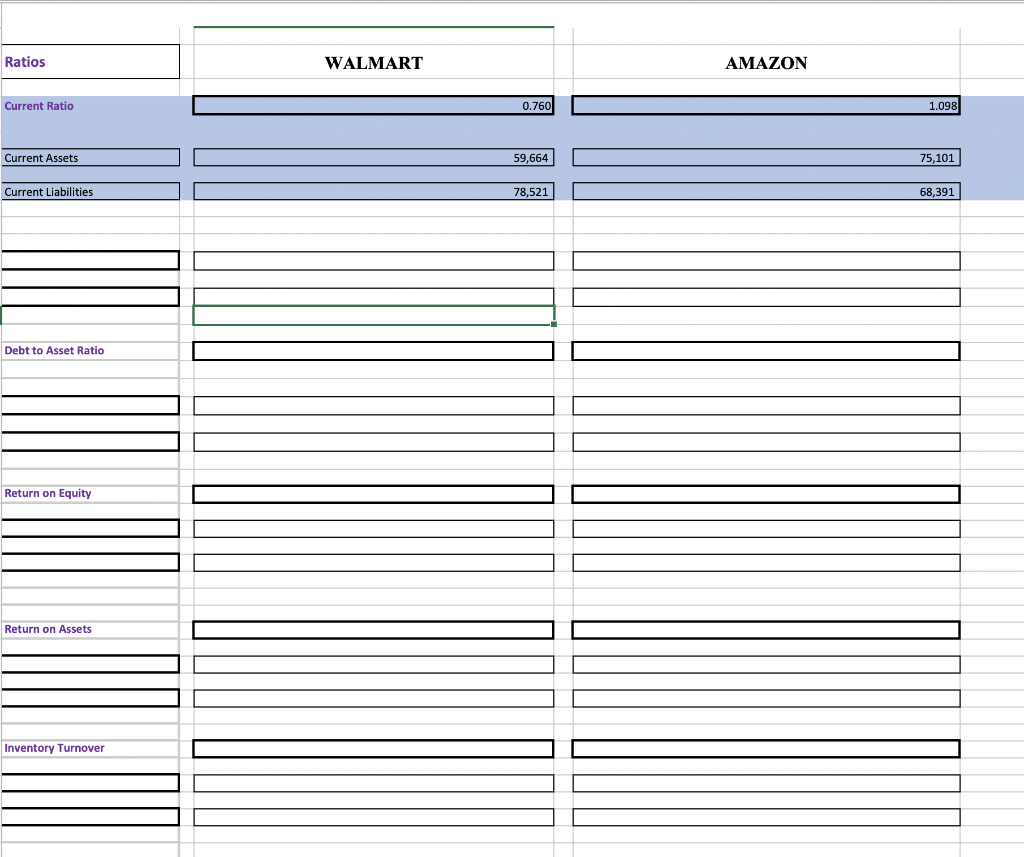
YOU MUST USE FORMULAS AND CELL REFERENCES ON THE RATIOS PAGE FOR THE NUMBERS TO BE CONSIDERED FOR FULL CREDIT ON THE PROJECTS. You may


Step by Step Solution
There are 3 Steps involved in it
Step: 1

Get Instant Access to Expert-Tailored Solutions
See step-by-step solutions with expert insights and AI powered tools for academic success
Step: 2

Step: 3
Ace Your Homework with AI
Get the answers you need in no time with our AI-driven, step-by-step assistance
Get Started
The Customer Base Audit The First Step On The Journey To Customer Centricity
Authors: Peter Fader, Bruce G.S. Hardie, Michael Ross
1st Edition
1613631618, 978-1613631614