

Question
You notice that the type of phone someone has and the computer operating system they use seems to be related. To determine if Phone and


You notice that the type of phone someone has and the computer operating system they use seems to be related. To determine if Phone and Computer OS are dependent, what are the appropriate hypotheses?
Question 1 options:
1)
HO: Phone and Computer OS are independent of each other.
HA: Phone and Computer OS are related to each other.
2)
HO: Phone and Computer OS are related to one another.
HA: Phone and Computer OS are independent of each other.
3)
HO: Phone and Computer OS are not related to one another.
HA: Phone and Computer OS display a negative correlation.
4)
HO: Phone and Computer OS are not related to one another.
HA: Phone and Computer OS display a positive correlation.
5)
There is not enough information to choose the correct set of hypotheses.
Question 2(1 point)
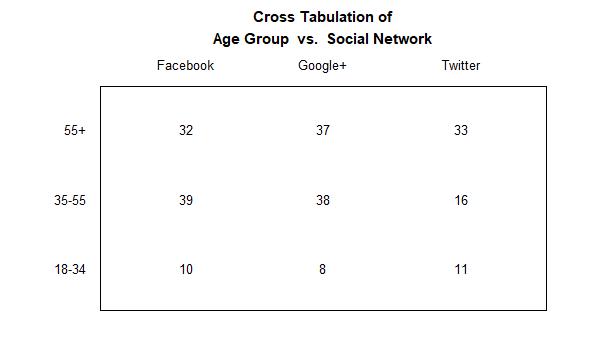
A marketing research firm wanted to determine whether an individual's favored Age Group and Social Network were related. For age they grouped by 18-34, 35-55, and 55+ and the social networks they investigated were Facebook, Google+, and Twitter. The table below presents their findings. To test at the 0.1 level to determine if Age Group and Social Network are dependent, calculate the chi-square test statistic and p-value.


Step by Step Solution
There are 3 Steps involved in it
Step: 1

Get Instant Access to Expert-Tailored Solutions
See step-by-step solutions with expert insights and AI powered tools for academic success
Step: 2

Step: 3
Ace Your Homework with AI
Get the answers you need in no time with our AI-driven, step-by-step assistance
Get Started
Real Analysis
Authors: N L Carothers
1st Edition
1139632434, 9781139632430