You own a local coffee shop, most of your current sales take place in the morning, you want to introduce some additional drinks to the menu that will drive store traffic Youspend 10k to develop new drink choices to add to the menu, 150 units per day of these drinks in first year, expected growthis 2% per year, offer this for 5 years, 360 days out of the year, 5.per drink and variable cost is 2.80, only 75% of the gross port will be incremental, $8000 modifications, incremental fixed costs=45k annually, equipment is depreciated to $0 value over the 5 years of the project using straight line method, better estimate of its selling price in 5 years is 15k
You will need to add your inventory in order to have enough supplies, to meet daily demand between your supplier deliveries, estimated this is be 5% of the next years sales and tax rate is 21%, cost of capital is 12%, find IRR and NPV should you take on this investment?
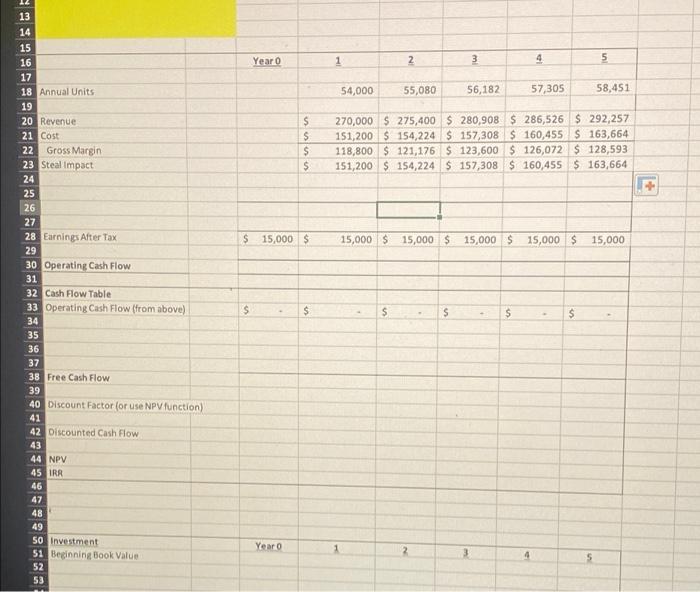
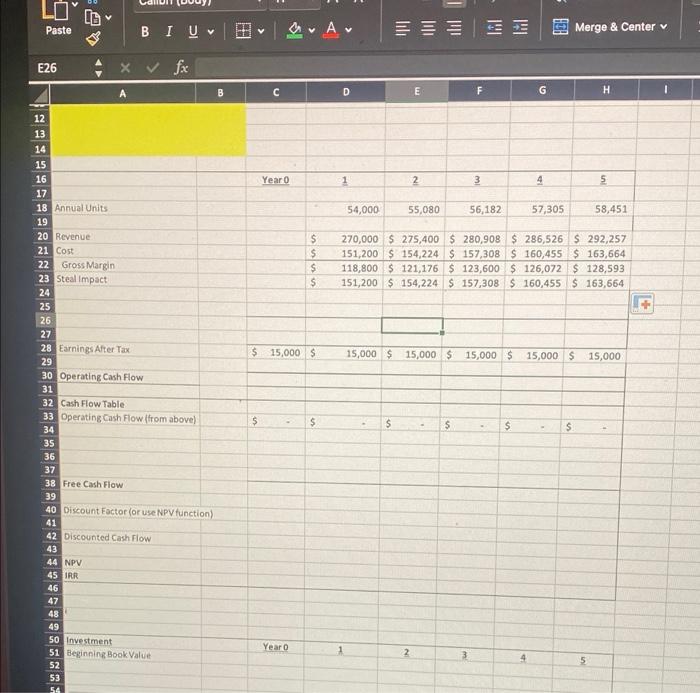
please answer the questions details in this excel workbook formatting
Year 0 1 2 3 4 5 54,000 55,080 56,182 57,305 58,451 $ $ $ $ 270,000 $ 275,400 $ 280,908 $ 286,526 $ 292,257 151,200 $ 154,224 S 157,308 $ 160,455 S 163,664 118,800 $ 121,176 $ 123,600 $ 126,072 $ 128,593 151,200 $ 154,224 $ 157,308 $ 160,455 $ 163,664 $ 15,000 $ 15,000 $15,000 $15,000 $ 15,000 $15,000 13 14 15 16 17 18 Annual Units 19 20 Revenue 21 Cost 22 Gross Margin 23 Steal Impact 24 25 26 27 28 Earnings After Tax 29 30 Operating Cash Flow 31 32 Cash Flow Table 33 Operating Cash Flow (from above) 34 35 36 37 38 Free Cash Flow 39 40 Discount Factor (or use NPV function) 41 42 Discounted Cash Flow 43 44 NPV 45 IRR 46 47 48 49 50 Investment 51 Beginning Book Value 52 53 $ $ $ $ $ $ Year o 4 5 [D Paste BIU V IA Merge & Center E26 4 X fx B D F G H Year o 1 NI 2 3 4 5 54,000 55,080 56,182 57,305 58,451 $ $ $ $ 270,000 $275,400 $ 280,908 $ 286,526 $ 292,257 151,200 $ 154,224 $ 157,308 $ 160,455 $ 163,664 118,800 $ 121,176 $ 123,600 $ 126,072 $ 128,593 151,200 $ 154,224 $ 157,308 $ 160,455 $ 163,664 [+ $ 15,000 $ 15,000 $ 15,000 $15,000 $ 15,000 $ 15,000 12 13 14 15 16 17 18 Annual Units 19 20 Revenue 21 Cost 22 Gross Margin 23 Steal Impact 24 25 26 27 28 Earnings Alter Tax 29 30 Operating Cash Flow 31 32 Cash Flow Table 33 Operating Cash Flow from above) 34 35 36 37 38 Free Cash Flow 39 40 Discount Factor (or use NPV function) 41 42 Discounted Cash Flow 43 44 NPV 45 IRR 46 47 48 49 50 Investment 51 Beginning Book Value S2 53 54 $ $ $ $ $ $ $ Year 2 3 4 5 Year 0 1 2 3 4 5 54,000 55,080 56,182 57,305 58,451 $ $ $ $ 270,000 $ 275,400 $ 280,908 $ 286,526 $ 292,257 151,200 $ 154,224 S 157,308 $ 160,455 S 163,664 118,800 $ 121,176 $ 123,600 $ 126,072 $ 128,593 151,200 $ 154,224 $ 157,308 $ 160,455 $ 163,664 $ 15,000 $ 15,000 $15,000 $15,000 $ 15,000 $15,000 13 14 15 16 17 18 Annual Units 19 20 Revenue 21 Cost 22 Gross Margin 23 Steal Impact 24 25 26 27 28 Earnings After Tax 29 30 Operating Cash Flow 31 32 Cash Flow Table 33 Operating Cash Flow (from above) 34 35 36 37 38 Free Cash Flow 39 40 Discount Factor (or use NPV function) 41 42 Discounted Cash Flow 43 44 NPV 45 IRR 46 47 48 49 50 Investment 51 Beginning Book Value 52 53 $ $ $ $ $ $ Year o 4 5 [D Paste BIU V IA Merge & Center E26 4 X fx B D F G H Year o 1 NI 2 3 4 5 54,000 55,080 56,182 57,305 58,451 $ $ $ $ 270,000 $275,400 $ 280,908 $ 286,526 $ 292,257 151,200 $ 154,224 $ 157,308 $ 160,455 $ 163,664 118,800 $ 121,176 $ 123,600 $ 126,072 $ 128,593 151,200 $ 154,224 $ 157,308 $ 160,455 $ 163,664 [+ $ 15,000 $ 15,000 $ 15,000 $15,000 $ 15,000 $ 15,000 12 13 14 15 16 17 18 Annual Units 19 20 Revenue 21 Cost 22 Gross Margin 23 Steal Impact 24 25 26 27 28 Earnings Alter Tax 29 30 Operating Cash Flow 31 32 Cash Flow Table 33 Operating Cash Flow from above) 34 35 36 37 38 Free Cash Flow 39 40 Discount Factor (or use NPV function) 41 42 Discounted Cash Flow 43 44 NPV 45 IRR 46 47 48 49 50 Investment 51 Beginning Book Value S2 53 54 $ $ $ $ $ $ $ Year 2 3 4 5