Answered step by step
Verified Expert Solution
Question
1 Approved Answer
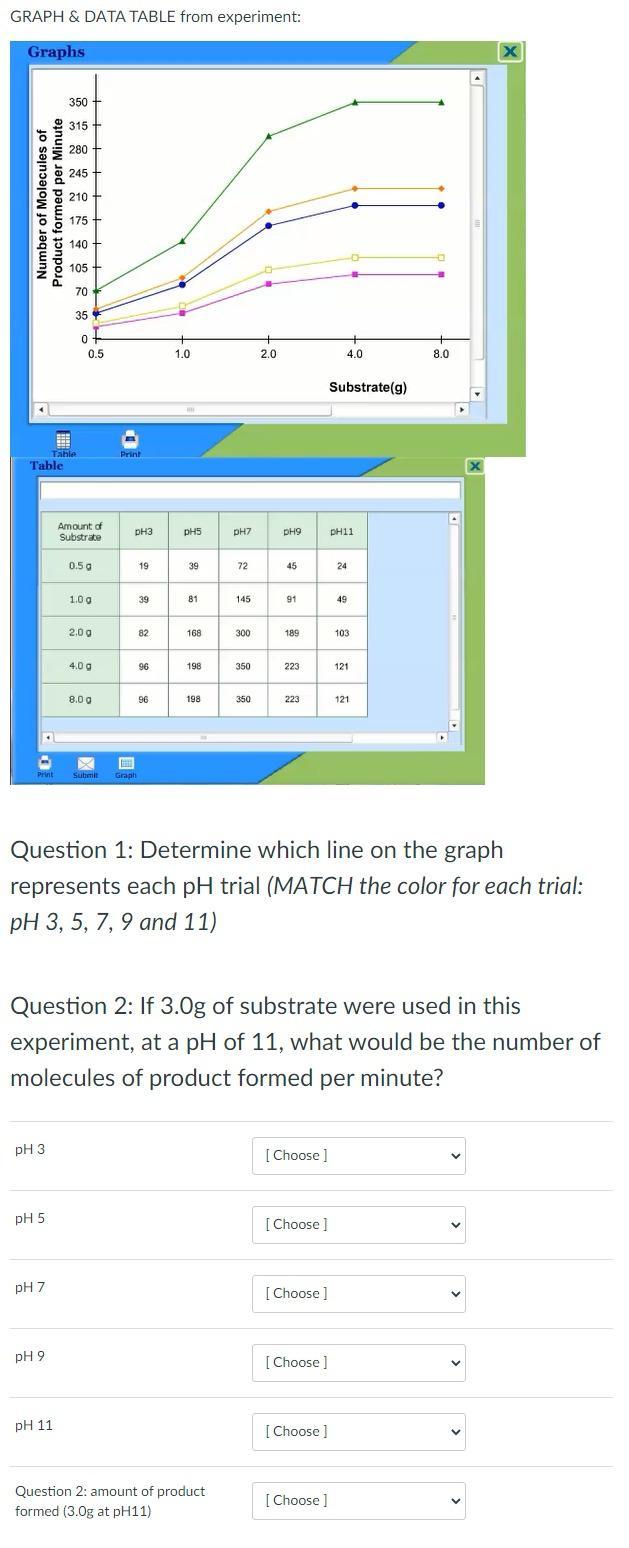
GRAPH & DATA TABLE from experiment: Graphs Number of Molecules of Product formed per Minute < Table - Print pH 3 pH 5 pH

GRAPH & DATA TABLE from experiment: Graphs Number of Molecules of Product formed per Minute < Table - Print pH 3 pH 5 pH 7 350 315 280 Table pH 9 245 210 175 140 105 70 35 pH 11 of 0.5 Amount of Substrate 0.5 g 1.0 g 2.0 g 4.0 g 8.00 Print pH3 Submit Graph 19 39 82 96 96 1.0 pH5 39 81 168 198 198 pH7 72 Question 2: amount of product formed (3.0g at pH11) 145 300 350 350 2.0 pH9 45 91 189 223 223 [Choose ] [Choose ] [Choose ] [Choose ] 4.0 Question 1: Determine which line on the graph represents each pH trial (MATCH the color for each trial: pH 3, 5, 7, 9 and 11) [Choose ] Substrate (g) Question 2: If 3.0g of substrate were used in this experiment, at a pH of 11, what would be the number of molecules of product formed per minute? [Choose ] pH11 24 49 103 121 121 8.0 A = X
Step by Step Solution
★★★★★
3.42 Rating (146 Votes )
There are 3 Steps involved in it
Step: 1
Answer1 a Amount of lactose taken is the independent variable b Number of product molecules formed i...
Get Instant Access to Expert-Tailored Solutions
See step-by-step solutions with expert insights and AI powered tools for academic success
Step: 2

Step: 3

Ace Your Homework with AI
Get the answers you need in no time with our AI-driven, step-by-step assistance
Get Started


