

Answered step by step
Verified Expert Solution
Question
1 Approved Answer
You plan to test the market efficiency of NYSE using an event study methodology focusing on whether acquiring firms experience share price reactions to takeover
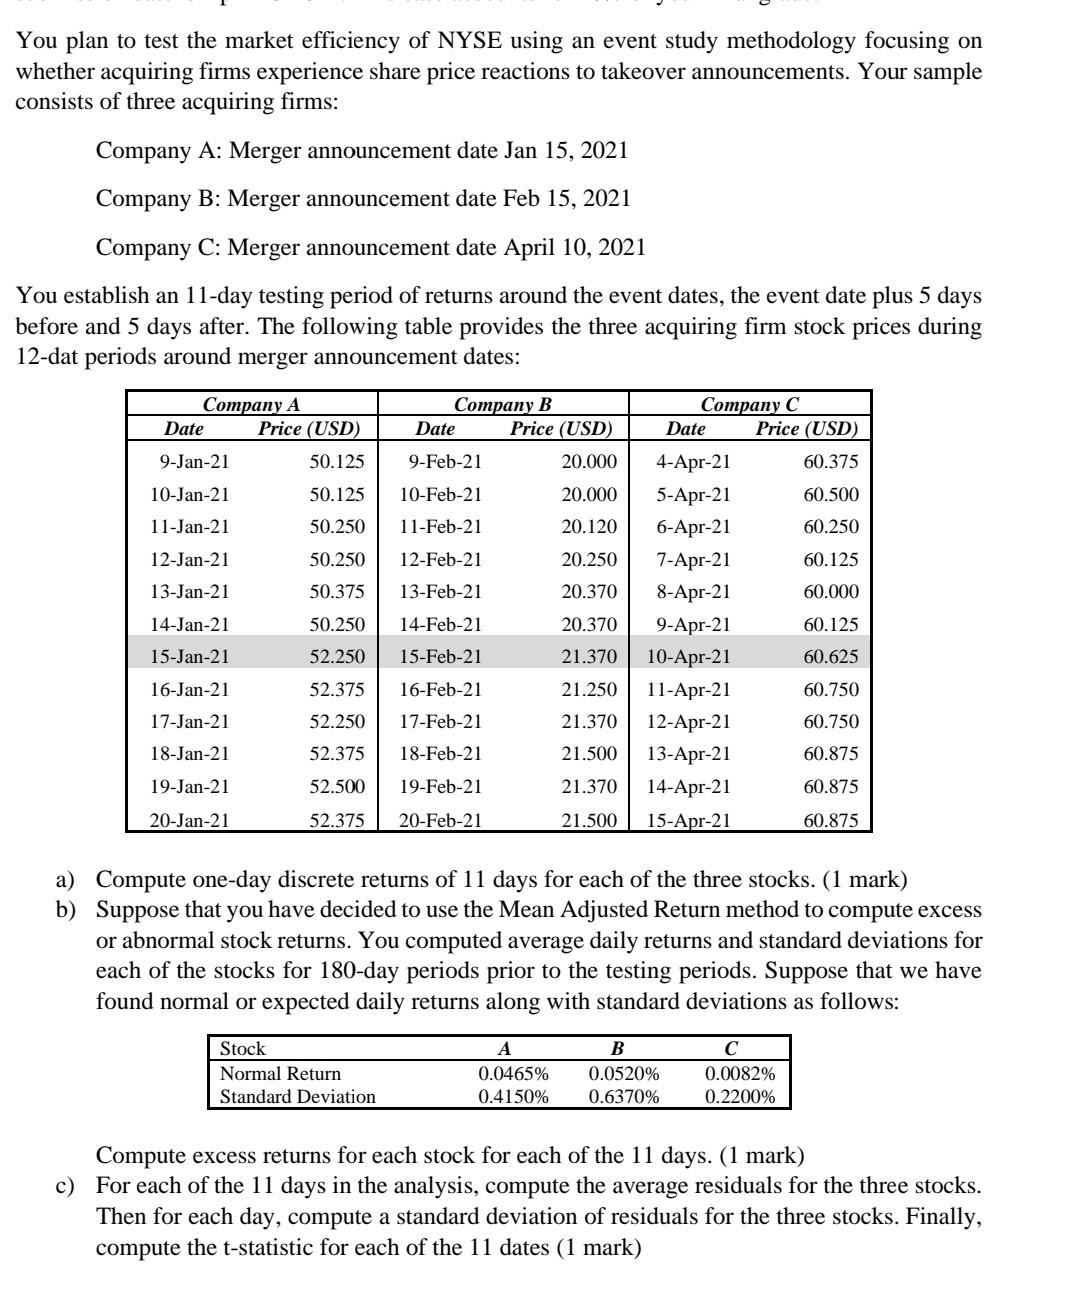
You plan to test the market efficiency of NYSE using an event study methodology focusing on whether acquiring firms experience share price reactions to takeover announcements. Your sample consists of three acquiring firms: Company A: Merger announcement date Jan 15, 2021 Company B: Merger announcement date Feb 15, 2021 Company C: Merger announcement date April 10, 2021 You establish an 11-day testing period of returns around the event dates, the event date plus 5 days before and 5 days after. The following table provides the three acquiring firm stock prices during 12-dat periods around merger announcement dates: Company A Date Price (USD) Company B Date Price (USD) 9-Jan-21 50.125 9-Feb-21 20.000 50.125 10-Feb-21 20.000 10-Jan-21 11-Jan-21 50.250 11-Feb-21 20.120 12-Jan-21 50.250 20.250 12-Feb-21 13-Feb-21 50.375 20.370 13-Jan-21 14-Jan-21 Company C Date Price (USD) 4-Apr-21 60.375 5-Apr-21 60.500 6-Apr-21 60.250 7-Apr-21 60.125 8-Apr-21 60.000 9-Apr-21 60.125 10-Apr-21 60.625 11-Apr-21 60.750 12-Apr-21 60.750 13-Apr-21 60.875 14-Apr-21 60.875 15-Apr-21 60.875 50.250 14-Feb-21 20.370 21.370 15-Jan-21 52.250 15-Feb-21 52.375 16-Jan-21 17-Jan-21 18-Jan-21 16-Feb-21 17-Feb-21 52.250 52.375 52.500 21.250 21.370 21.500 18-Feb-21 19-Jan-21 19-Feb-21 21.370 20-Jan-21 52.375 20-Feb-21 21.500 a) Compute one-day discrete returns of 11 days for each of the three stocks. (1 mark) b) Suppose that you have decided to use the Mean Adjusted Return method to compute excess or abnormal stock returns. You computed average daily returns and standard deviations for each of the stocks for 180-day periods prior to the testing periods. Suppose that we have found normal or expected daily returns along with standard deviations as follows: Stock Normal Return Standard Deviation A 0.0465% 0.4150% B 0.0520% 0.6370% 0.0082% 0.2200% Compute excess returns for each stock for each of the 11 days. (1 mark) c) For each of the 11 days in the analysis, compute the average residuals for the three stocks. Then for each day, compute a standard deviation of residuals for the three stocks. Finally, compute the t-statistic for each of the 11 dates (1 mark) d) Does there appear to be statistically significant evidence of abnormal acquiring firm returns around announcement dates? (1 mark) e) Compute cumulative average residuals (CARs) for each of the 11 dates. (1 mark) f) Draw the CARs for the three stocks. (1 mark) g) Compute standard deviations and t-statistic for each of the 11 dates. For the CARs (1 mark) h) Write down the hypothesis you are testing, show the critical values at 95% significance level. (1 mark) i) Test the hypothesis that you wrote in part h. Are the average residuals for any of the dates statistically significant at the 95% level? (1 mark) j) Can you make a conclusion about the market efficiency in this case? Why or why not? (1 mark) Enjoy the exercise You plan to test the market efficiency of NYSE using an event study methodology focusing on whether acquiring firms experience share price reactions to takeover announcements. Your sample consists of three acquiring firms: Company A: Merger announcement date Jan 15, 2021 Company B: Merger announcement date Feb 15, 2021 Company C: Merger announcement date April 10, 2021 You establish an 11-day testing period of returns around the event dates, the event date plus 5 days before and 5 days after. The following table provides the three acquiring firm stock prices during 12-dat periods around merger announcement dates: Company A Date Price (USD) Company B Date Price (USD) 9-Jan-21 50.125 9-Feb-21 20.000 50.125 10-Feb-21 20.000 10-Jan-21 11-Jan-21 50.250 11-Feb-21 20.120 12-Jan-21 50.250 20.250 12-Feb-21 13-Feb-21 50.375 20.370 13-Jan-21 14-Jan-21 Company C Date Price (USD) 4-Apr-21 60.375 5-Apr-21 60.500 6-Apr-21 60.250 7-Apr-21 60.125 8-Apr-21 60.000 9-Apr-21 60.125 10-Apr-21 60.625 11-Apr-21 60.750 12-Apr-21 60.750 13-Apr-21 60.875 14-Apr-21 60.875 15-Apr-21 60.875 50.250 14-Feb-21 20.370 21.370 15-Jan-21 52.250 15-Feb-21 52.375 16-Jan-21 17-Jan-21 18-Jan-21 16-Feb-21 17-Feb-21 52.250 52.375 52.500 21.250 21.370 21.500 18-Feb-21 19-Jan-21 19-Feb-21 21.370 20-Jan-21 52.375 20-Feb-21 21.500 a) Compute one-day discrete returns of 11 days for each of the three stocks. (1 mark) b) Suppose that you have decided to use the Mean Adjusted Return method to compute excess or abnormal stock returns. You computed average daily returns and standard deviations for each of the stocks for 180-day periods prior to the testing periods. Suppose that we have found normal or expected daily returns along with standard deviations as follows: Stock Normal Return Standard Deviation A 0.0465% 0.4150% B 0.0520% 0.6370% 0.0082% 0.2200% Compute excess returns for each stock for each of the 11 days. (1 mark) c) For each of the 11 days in the analysis, compute the average residuals for the three stocks. Then for each day, compute a standard deviation of residuals for the three stocks. Finally, compute the t-statistic for each of the 11 dates (1 mark) d) Does there appear to be statistically significant evidence of abnormal acquiring firm returns around announcement dates? (1 mark) e) Compute cumulative average residuals (CARs) for each of the 11 dates. (1 mark) f) Draw the CARs for the three stocks. (1 mark) g) Compute standard deviations and t-statistic for each of the 11 dates. For the CARs (1 mark) h) Write down the hypothesis you are testing, show the critical values at 95% significance level. (1 mark) i) Test the hypothesis that you wrote in part h. Are the average residuals for any of the dates statistically significant at the 95% level? (1 mark) j) Can you make a conclusion about the market efficiency in this case? Why or why not? (1 mark) Enjoy the exercise
Step by Step Solution
There are 3 Steps involved in it
Step: 1

Get Instant Access to Expert-Tailored Solutions
See step-by-step solutions with expert insights and AI powered tools for academic success
Step: 2

Step: 3
Ace Your Homework with AI
Get the answers you need in no time with our AI-driven, step-by-step assistance
Get Started
FINA 6201 Financial Theory And Policy Emery Trahan
Authors: Emery Trahan
1st Edition
1609270754