Question
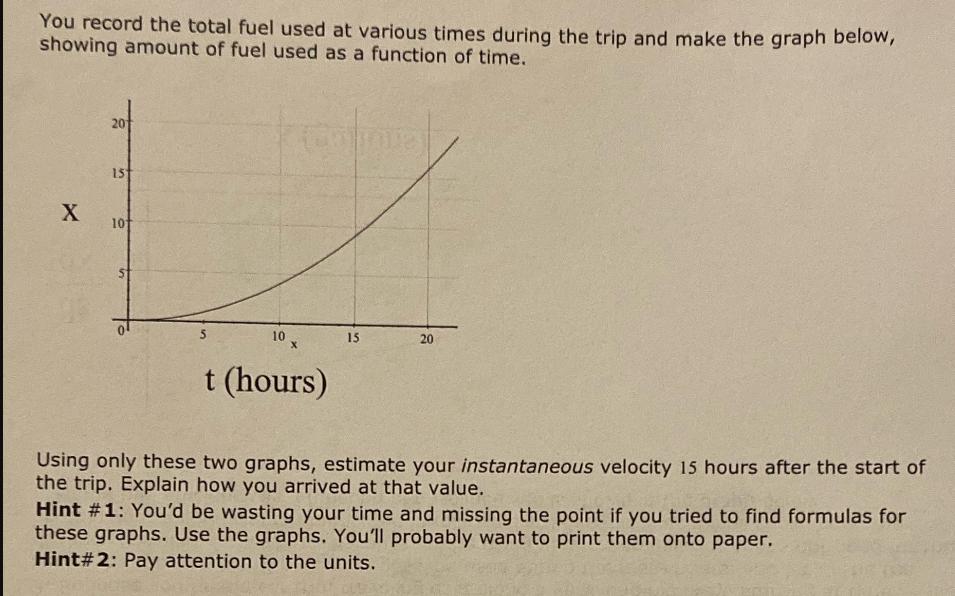
You record the total fuel used at various times during the trip and make the graph below, showing amount of fuel used as a

You record the total fuel used at various times during the trip and make the graph below, showing amount of fuel used as a function of time. X 15 10 10 15 20 t (hours) Using only these two graphs, estimate your instantaneous velocity 15 hours after the start of the trip. Explain how you arrived at that value. Hint #1: You'd be wasting your time and missing the point if you tried to find formulas for these graphs. Use the graphs. You'll probably want to print them onto paper. Hint#2: Pay attention to the units.
Step by Step Solution
There are 3 Steps involved in it
Step: 1

Get Instant Access to Expert-Tailored Solutions
See step-by-step solutions with expert insights and AI powered tools for academic success
Step: 2

Step: 3

Ace Your Homework with AI
Get the answers you need in no time with our AI-driven, step-by-step assistance
Get StartedRecommended Textbook for
Elements Of Chemical Reaction Engineering
Authors: H. Fogler
6th Edition
013548622X, 978-0135486221
Students also viewed these Mathematics questions
Question
Answered: 1 week ago
Question
Answered: 1 week ago
Question
Answered: 1 week ago
Question
Answered: 1 week ago
Question
Answered: 1 week ago
Question
Answered: 1 week ago
Question
Answered: 1 week ago
Question
Answered: 1 week ago
Question
Answered: 1 week ago
Question
Answered: 1 week ago
Question
Answered: 1 week ago
Question
Answered: 1 week ago
Question
Answered: 1 week ago
Question
Answered: 1 week ago
Question
Answered: 1 week ago
Question
Answered: 1 week ago
Question
Answered: 1 week ago
Question
Answered: 1 week ago
Question
Answered: 1 week ago
Question
Answered: 1 week ago
Question
Answered: 1 week ago
Question
Answered: 1 week ago
View Answer in SolutionInn App


