

Answered step by step
Verified Expert Solution
Question
1 Approved Answer
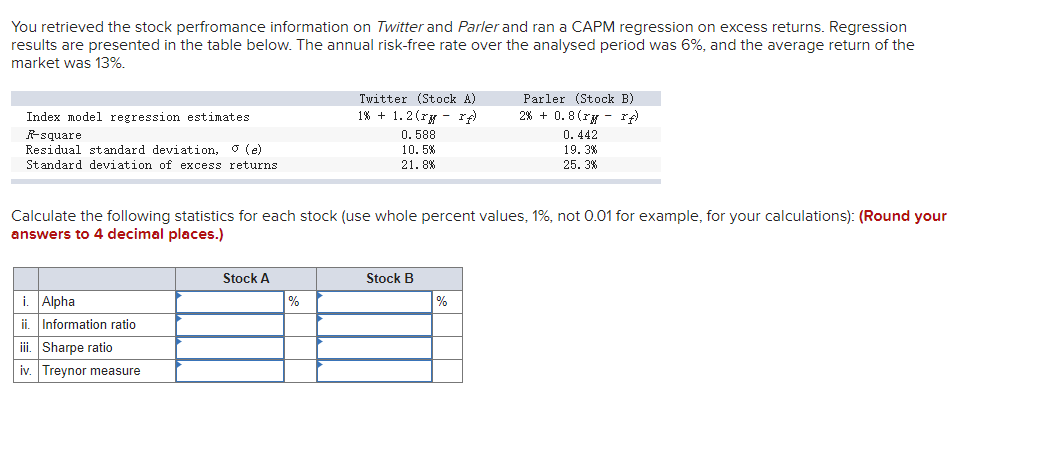
You retrieved the stock perfromance information on Twitter and Parler and ran a CAPM regression on excess returns. Regression results are presented in the table
Step by Step Solution
There are 3 Steps involved in it
Step: 1

Get Instant Access to Expert-Tailored Solutions
See step-by-step solutions with expert insights and AI powered tools for academic success
Step: 2

Step: 3
Ace Your Homework with AI
Get the answers you need in no time with our AI-driven, step-by-step assistance
Get Started
School Finance Elections
Authors: Don E. Lifto, Bradford J. Senden, Daniel A. Domenech
2nd Edition