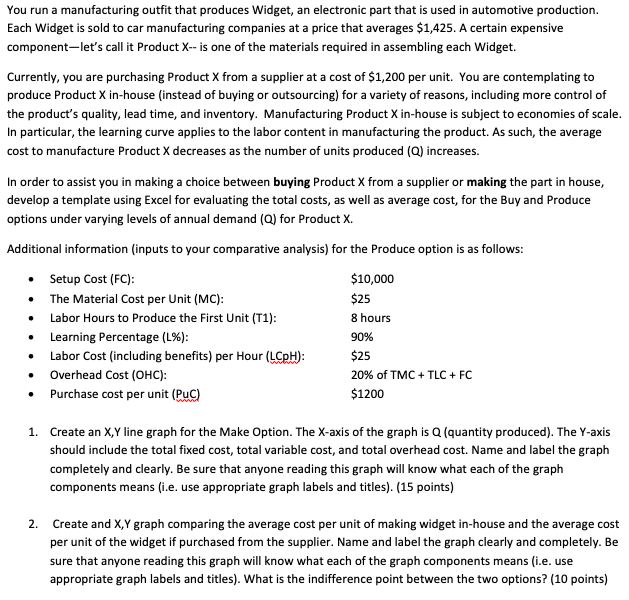
You run a manufacturing outfit that produces Widget, an electronic part that is used in automotive production. Each Widget is sold to car manufacturing companies at a price that averages $1,425. A certain expensive component-let's call it Product X-- is one of the materials required in assembling each Widget. Currently, you are purchasing Product X from a supplier at a cost of $1,200 per unit. You are contemplating to produce Product X in-house (instead of buying or outsourcing) for a variety of reasons, including more control of the product's quality, lead time, and inventory. Manufacturing Product X in-house is subject to economies of scale. In particular, the learning curve applies to the labor content in manufacturing the product. As such, the average cost to manufacture Product X decreases as the number of units produced (Q) increases. In order to assist you in making a choice between buying Product X from a supplier or making the part in house, develop a template using Excel for evaluating the total costs, as well as average cost, for the Buy and Produce options under varying levels of annual demand (Q) for Product X. Additional information (inputs to your comparative analysis) for the Produce option is as follows: Setup Cost (FC): The Material Cost per Unit (MC): Labor Hours to Produce the First Unit (T1): Learning Percentage (L%): Labor Cost (including benefits) per Hour (LCpH): Overhead Cost (OHC): Purchase cost per unit (Puc) $10,000 $25 8 hours 90% $25 20% of TMC + TLC + FC $1200 1. Create an X,Y line graph for the Make Option. The X-axis of the graph is Q (quantity produced). The Y-axis should include the total fixed cost, total variable cost, and total overhead cost. Name and label the graph completely and clearly. Be sure that anyone reading this graph will know what each of the graph components means (i.e. use appropriate graph labels and titles). (15 points) 2. Create and X,Y graph comparing the average cost per unit of making widget in-house and the average cost per unit of the widget if purchased from the supplier. Name and label the graph clearly and completely. Be sure that anyone reading this graph will know what each of the graph components means (i.e. use appropriate graph labels and titles). What is the indifference point between the two options? (10 points) You run a manufacturing outfit that produces Widget, an electronic part that is used in automotive production. Each Widget is sold to car manufacturing companies at a price that averages $1,425. A certain expensive component-let's call it Product X-- is one of the materials required in assembling each Widget. Currently, you are purchasing Product X from a supplier at a cost of $1,200 per unit. You are contemplating to produce Product X in-house (instead of buying or outsourcing) for a variety of reasons, including more control of the product's quality, lead time, and inventory. Manufacturing Product X in-house is subject to economies of scale. In particular, the learning curve applies to the labor content in manufacturing the product. As such, the average cost to manufacture Product X decreases as the number of units produced (Q) increases. In order to assist you in making a choice between buying Product X from a supplier or making the part in house, develop a template using Excel for evaluating the total costs, as well as average cost, for the Buy and Produce options under varying levels of annual demand (Q) for Product X. Additional information (inputs to your comparative analysis) for the Produce option is as follows: Setup Cost (FC): The Material Cost per Unit (MC): Labor Hours to Produce the First Unit (T1): Learning Percentage (L%): Labor Cost (including benefits) per Hour (LCpH): Overhead Cost (OHC): Purchase cost per unit (Puc) $10,000 $25 8 hours 90% $25 20% of TMC + TLC + FC $1200 1. Create an X,Y line graph for the Make Option. The X-axis of the graph is Q (quantity produced). The Y-axis should include the total fixed cost, total variable cost, and total overhead cost. Name and label the graph completely and clearly. Be sure that anyone reading this graph will know what each of the graph components means (i.e. use appropriate graph labels and titles). (15 points) 2. Create and X,Y graph comparing the average cost per unit of making widget in-house and the average cost per unit of the widget if purchased from the supplier. Name and label the graph clearly and completely. Be sure that anyone reading this graph will know what each of the graph components means (i.e. use appropriate graph labels and titles). What is the indifference point between the two options? (10 points)