Question
You want to check whether a single factor model explains the excess return of Apple Inc. stock using the overall market performance. Data source

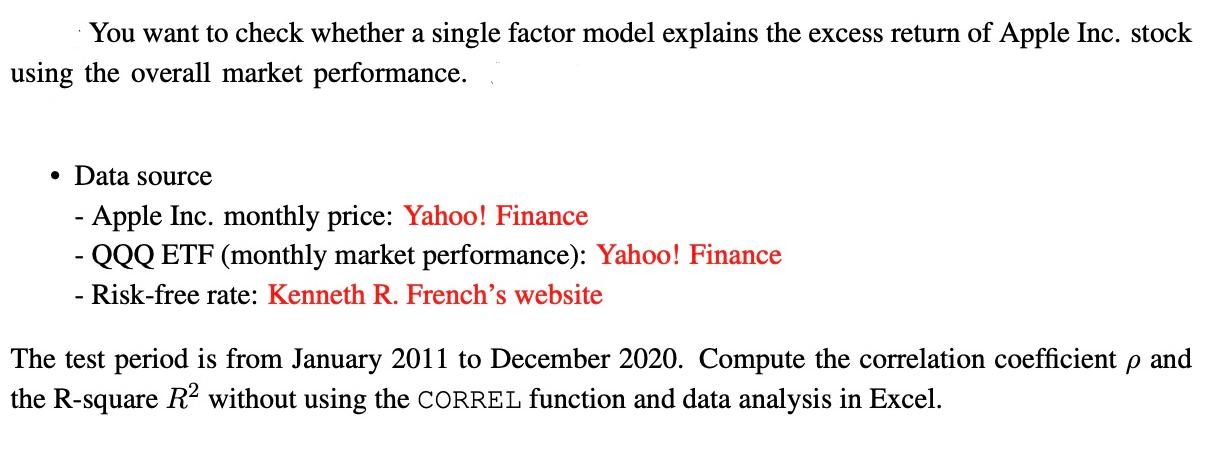
You want to check whether a single factor model explains the excess return of Apple Inc. stock using the overall market performance. Data source - Apple Inc. monthly price: Yahoo! Finance - QQQ ETF (monthly market performance): Yahoo! Finance Risk-free rate: Kenneth R. French's website The test period is from January 2011 to December 2020. Compute the correlation coefficient p and the R-square R without using the CORREL function and data analysis in Excel.
Step by Step Solution
3.45 Rating (148 Votes )
There are 3 Steps involved in it
Step: 1
You want to check whether a single factor model explains the excess return of Apple Inc ...
Get Instant Access to Expert-Tailored Solutions
See step-by-step solutions with expert insights and AI powered tools for academic success
Step: 2

Step: 3

Ace Your Homework with AI
Get the answers you need in no time with our AI-driven, step-by-step assistance
Get StartedRecommended Textbook for
Statistics For Business Decision Making And Analysis
Authors: Robert Stine, Dean Foster
2nd Edition
978-0321836519, 321836510, 978-0321890269
Students also viewed these Finance questions
Question
Answered: 1 week ago
Question
Answered: 1 week ago
Question
Answered: 1 week ago
Question
Answered: 1 week ago
Question
Answered: 1 week ago
Question
Answered: 1 week ago
Question
Answered: 1 week ago
Question
Answered: 1 week ago
Question
Answered: 1 week ago
Question
Answered: 1 week ago
Question
Answered: 1 week ago
Question
Answered: 1 week ago
Question
Answered: 1 week ago
Question
Answered: 1 week ago
Question
Answered: 1 week ago
Question
Answered: 1 week ago
Question
Answered: 1 week ago
Question
Answered: 1 week ago
Question
Answered: 1 week ago
Question
Answered: 1 week ago
Question
Answered: 1 week ago
View Answer in SolutionInn App


