

Answered step by step
Verified Expert Solution
Question
1 Approved Answer
You want to develop a three-signa R chart, You know the average range is 5 based on several samples of size 10 . The average
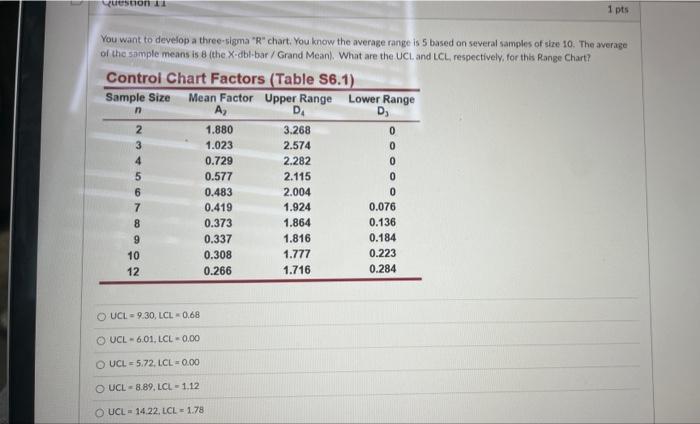 You want to develop a three-signa "R" chart, You know the average range is 5 based on several samples of size 10 . The average of the sample means is 8 (the X-dbl-bar / Grand Mean). What are the UCL and LCL, respectively, for this Range Chart? UCL=9.30,LCL=0.68UCL=6.01,LCL=0.00UCL=5.72,LCL=0.00UCL=8.89,LCL=1.12UCL=14.22,LCL=1.78
Step by Step Solution
There are 3 Steps involved in it
Step: 1

Get Instant Access to Expert-Tailored Solutions
See step-by-step solutions with expert insights and AI powered tools for academic success
Step: 2

Step: 3
Ace Your Homework with AI
Get the answers you need in no time with our AI-driven, step-by-step assistance
Get Started
Financial Accounting Preparing Financial Statements Study Text
Authors: Kaplan
1st Edition
9781839965685