

Question
You will apply the statistical concepts and techniques covered in this week's reading about correlation coefficient and simple linear regression. A car rental company wants


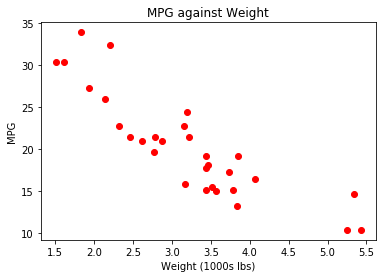
You will apply the statistical concepts and techniques covered in this week's reading about correlation coefficient and simple linear regression. A car rental company wants to evaluate the premise that heavier cars are less fuel efficient than lighter cars. In other words, the company expects that fuel efficiency (miles per gallon) and weight of the car (often measured in thousands of pounds) are correlated. Performing this analysis will help the company optimize its business model and charge its customers appropriately.
You will work with a cars data set that includes two variables:
- Miles per gallon (coded as mpg in the data set)
- Weight of the car (coded as wt in the data set)
1. You created a scatterplot of miles per gallon against weight. Does the graph show any trend? If yes, is the trend what you expected? Why or why not? See graph below:
Step by Step Solution
There are 3 Steps involved in it
Step: 1

Get Instant Access to Expert-Tailored Solutions
See step-by-step solutions with expert insights and AI powered tools for academic success
Step: 2

Step: 3
Ace Your Homework with AI
Get the answers you need in no time with our AI-driven, step-by-step assistance
Get Started
Algebra And Number Theory An Integrated Approach
Authors: Martyn R Dixon, Leonid A Kurdachenko, Igor Ya Subbotin
1st Edition
0470640537, 9780470640531