Answered step by step
Verified Expert Solution
Link Copied!

Question

1 Approved Answer

You will investigate profits using systems of equations. Part I: Complete the following steps: Read Example 10 shown below Use the GeoGebra tool in Canvas

You will investigate profits using systems of equations. Part I: Complete the following steps: Read Example 10 shown below

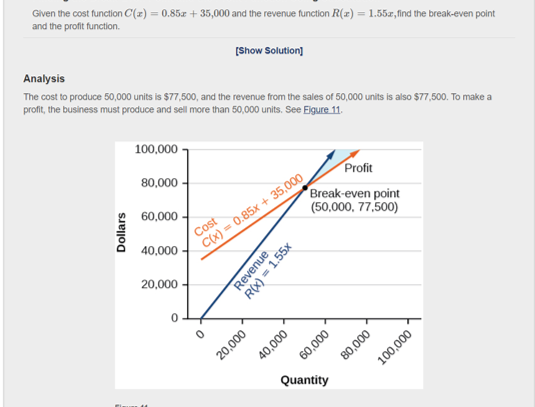
Use the GeoGebra tool in Canvas to graph the cost and revenue functions given in Example 10.

Identify the break-even point using the Intersect tool under Points. in geogebra

Part II: Based on your work in Part I, discuss the following:

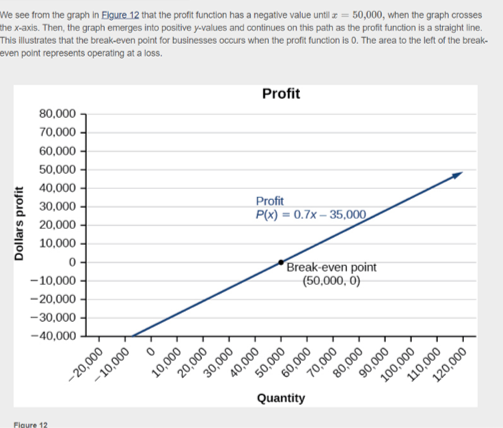
Discuss the part of the graph that represents the profit.

Discuss how you found the break-even point on the graph.

If you are performing a break-even analysis for a business and their cost and revenue equations are dependent, explain what this means for the companys profit margins.

If you are solving a break-even analysis and get more than one break-even point, explain what this signifies for the company?

If you are solving a break-even analysis and there is no break-even point, explain what this means for the company.

How should they ensure there is a break-even point?

Solve the following problem: An investor earned triple the profits of what she earned last year. If she made $500,000.48 total for both years, how much did she earn in profits each year?

Write an analysis of your solution to this problem similar to the one included at the end of Example 10. Describe the graph that could model this situation. Discuss how your answer would

be affected if: The amount earned for both years was increased. The investor only earned double the profits of what she earned last year.

image text in transcribed

image text in transcribed

Given the cost function C(=) = 0.853 +35,000 and the revenue function R() = 1.552, find the break-even point and the profit function [Show Solution] Analysis The cost to produce 50,000 units is $77,500, and the revenue from the sales of 50,000 units is also $77,500. To make a profit, the business must produce and sell more than 50,000 units. See Eigure 11. 100,000 Profit 80,000 Break-even point (50,000, 77,500) 60,000 Dollars Cost 40,000 C(x)=0.85x + 35,000 Revenue R(x) = 1.55x 20,000 0 20,000 60,000 40,000 80,000 100,000 Quantity We see from the graph in Egure 12 that the profit function has a negative value until z=50,000, when the graph crosses the x-axis. Then, the graph emerges into positive y-values and continues on this path as the profit function is a straight line This illustrates that the break-even point for businesses occurs when the profit function is 0. The area to the left of the break- even point represents operating at a loss Profit 80,000 70,000 60,000 50,000 40,000 30,000 20,000 10,000 Profit P(x) = 0.7x - 35,000 Dollars profit Break-even point (50,000,0) - 10,000 - 20,000 -30,000 - 40,000 30,000 20,000 10,000 70,000 80,000 60,000 100,000 110,000 120,000 90,000 -20,000 - 10,000 50,000 40,000 Quantity Figure 12 Given the cost function C(=) = 0.853 +35,000 and the revenue function R() = 1.552, find the break-even point and the profit function [Show Solution] Analysis The cost to produce 50,000 units is $77,500, and the revenue from the sales of 50,000 units is also $77,500. To make a profit, the business must produce and sell more than 50,000 units. See Eigure 11. 100,000 Profit 80,000 Break-even point (50,000, 77,500) 60,000 Dollars Cost 40,000 C(x)=0.85x + 35,000 Revenue R(x) = 1.55x 20,000 0 20,000 60,000 40,000 80,000 100,000 Quantity We see from the graph in Egure 12 that the profit function has a negative value until z=50,000, when the graph crosses the x-axis. Then, the graph emerges into positive y-values and continues on this path as the profit function is a straight line This illustrates that the break-even point for businesses occurs when the profit function is 0. The area to the left of the break- even point represents operating at a loss Profit 80,000 70,000 60,000 50,000 40,000 30,000 20,000 10,000 Profit P(x) = 0.7x - 35,000 Dollars profit Break-even point (50,000,0) - 10,000 - 20,000 -30,000 - 40,000 30,000 20,000 10,000 70,000 80,000 60,000 100,000 110,000 120,000 90,000 -20,000 - 10,000 50,000 40,000 Quantity Figure 12

Step by Step Solution

There are 3 Steps involved in it

Step: 1

blur-text-image

Get Instant Access to Expert-Tailored Solutions

See step-by-step solutions with expert insights and AI powered tools for academic success

Step: 2

blur-text-image

Step: 3

blur-text-image

Ace Your Homework with AI

Get the answers you need in no time with our AI-driven, step-by-step assistance

Get Started

Recommended Textbook for

FINANCIAL & MANAGERIAL ACCOUNTING FOR DECISION MAKERS

Authors: Dyckman, Hanlon, Magee, Pfeiffer, Hartgraves, Morse

3rd Edition

1618532340, 9781618532343

More Books

Students also viewed these Accounting questions

Question

How much are your customers worth to you over a lifetime of buying?

Answered: 1 week ago