Question
younger siblings seem to be quite the procrastinators. Decide to do some research on why and I found that some researchers think birth order has
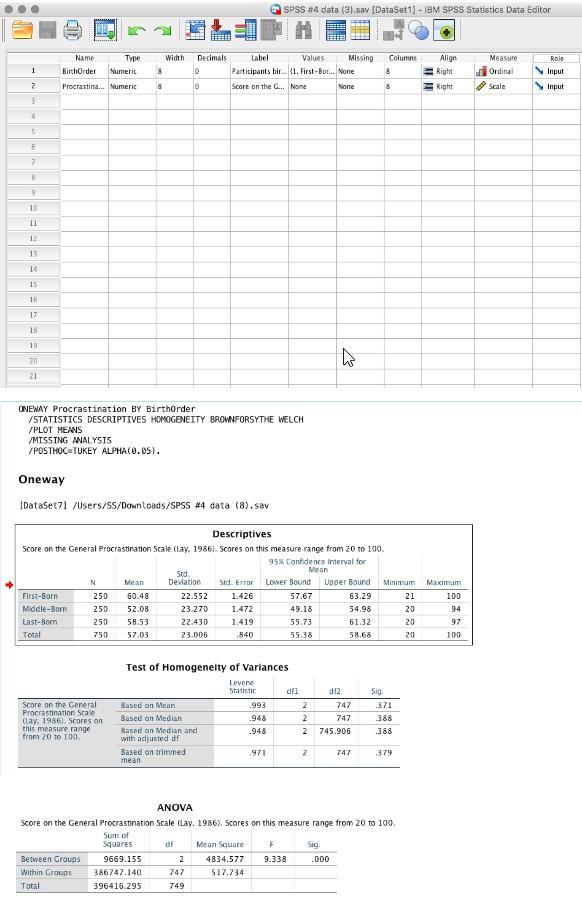
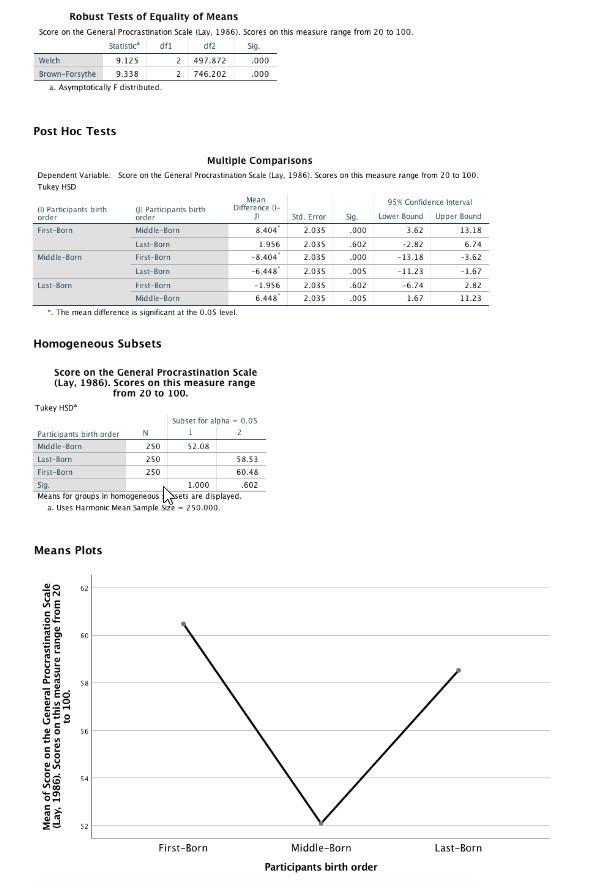
younger siblings seem to be quite the procrastinators. Decide to do some research on why and I found that some researchers think birth order has something to do with it. Intrigues by that idea, I collected data from several participants. I ask them their birth-order (first-born, middle-born, or last-born) and then have them complete the General Procrastination Scale (Lay, 1986). Scores on this measure range from 20 to 100 with higher scores representing higher procrastination and lower scores representing lower procrastination. Based on my prior research, I hypothesize that last-born participants are more likely to procrastinate than first-born or middle-born participants. Using SPSS, help me test my hypothesis by conducting the appropriate analysis. For post hoc test, select Tukey. Once you’ve conducted the analysis, answer the following questions. Below, I have included images from SPSS.
Using your output, choose the correct answers for each blank. Note: any p-values that = .000 in SPSS were rounded to p < .001.
Based on the output, first-borns (a. did not significantly differ on, b. had significantly higher, or c. had significantly lower) procrastination scores compared to last-borns, (a. p=.37, b. p<.001, c. p=.005, or d. p=.602).
9) Using your output, choose the correct answers for each blank. Note: any p-values that = .000 in SPSS were rounded to p < .001.
Based on the output, middle-borns (a. did not significantly differ on, b. had significantly higher, or c. had significantly lower) procrastination scores compared to last-borns (a. p=.005, b. p=.602, c. p=.371, or d. p<.001


1 2 3 4 5 BEEG========= 10 12 13 17 18 20 21 Name Type Numeric BirthOrder Procrastina... Numeric First-Born Middle-Born Last-Bom Total N Between Groups Within Groups Total 8 250 250 60.48 52.08 250 58.53 750 57.03 Score on the General Procrastination Scale (Lay, 1986). Scores on this measure range from 20 to 100. 8 ONEWAY Procrastination BY BirthOrder /STATISTICS DESCRIPTIVES HOMOGENEITY BROWNFORSYTHE WELCH /PLOT MEANS /MISSING ANALYSIS /POSTHOC TUKEY ALPHA(0.05). Oneway [DataSet7] /Users/SS/Downloads/SPSS #4 data (8).sav Mean Width Decimals Descriptives Score on the General Procrastination Scale (Lay, 1986). Scores on this measure range from 20 to 100. 95% Confidence interval for Mean 10 0 Sed Deviation Std. Error 1.426 1.472 1.419 840 df Label Values Missing Participants bir... 1, First-Bor... None Score on the G... None None 22.552 23.270 22.430 23.006 Based on Mean Based on Median Based on Median and with adjusted of Based on trimmed mean 2 747 749 Test of Homogeneity of Variances Levere Statistic SPSS #4 data (3).sav [DataSet1]-IBM SPSS Statistics Data Editor .993 Lower Bound Upper Bound 57.67 63.29 49.18 54.98 55.73 61.32 55.38 58.68 948 948 971 df1 222 Mean Square F 4834.577 9.338 517.734 2 W d12 747 747 745.906 Sig. .000 747 ANOVA Score on the General Procrastination Scale (Lay, 1986). Scores on this measure range from 20 to 100. Sum of Squares 9669.155 386747.140 396416.295 Columns 8 Sig. Minimum 371 .388 388 379 1888 21 20 20 20 11 Align Right Right Maximum 100 94 97 100 Measure Ordinal Scale Role Input Input
Step by Step Solution
3.44 Rating (157 Votes )
There are 3 Steps involved in it
Step: 1
Asnwer8 From the postHoc tests in multiple comparision table we can see that for the first born and ...
Get Instant Access to Expert-Tailored Solutions
See step-by-step solutions with expert insights and AI powered tools for academic success
Step: 2

Step: 3

Ace Your Homework with AI
Get the answers you need in no time with our AI-driven, step-by-step assistance
Get Started


