

Answered step by step
Verified Expert Solution
Question
1 Approved Answer
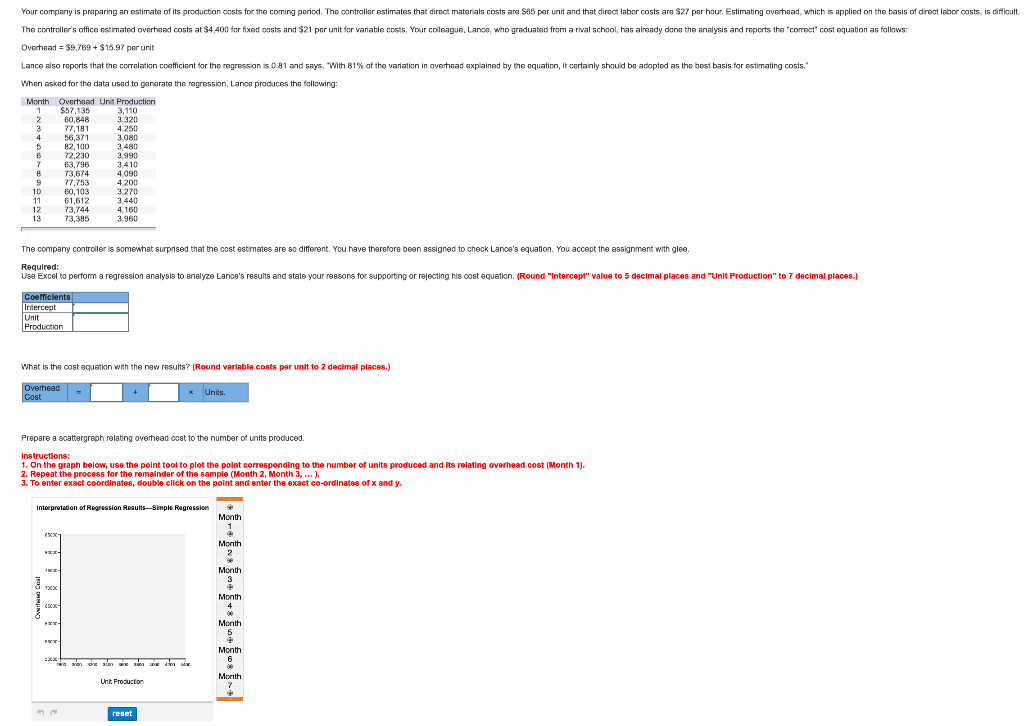
Your company is preparing an estimate of its production costs for the coming period. The controller estimates that direct materials costs are $65 per unit
Step by Step Solution
There are 3 Steps involved in it
Step: 1

Get Instant Access to Expert-Tailored Solutions
See step-by-step solutions with expert insights and AI powered tools for academic success
Step: 2

Step: 3
Ace Your Homework with AI
Get the answers you need in no time with our AI-driven, step-by-step assistance
Get Started
The Pricing Strategy Audit
Authors: Kent B. Monroe
1st Edition
1907766006, 978-1907766008