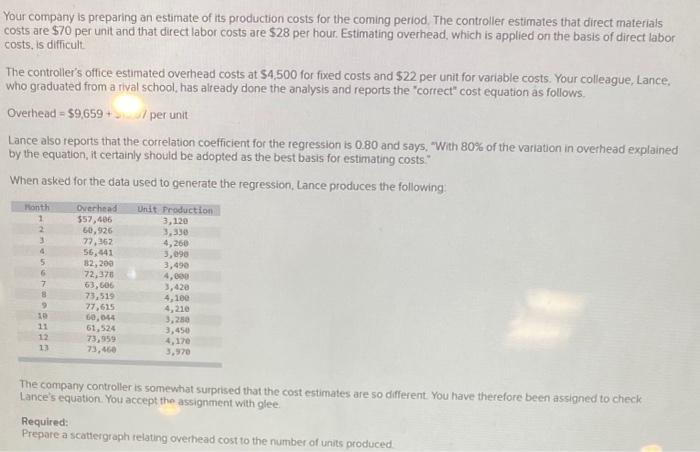
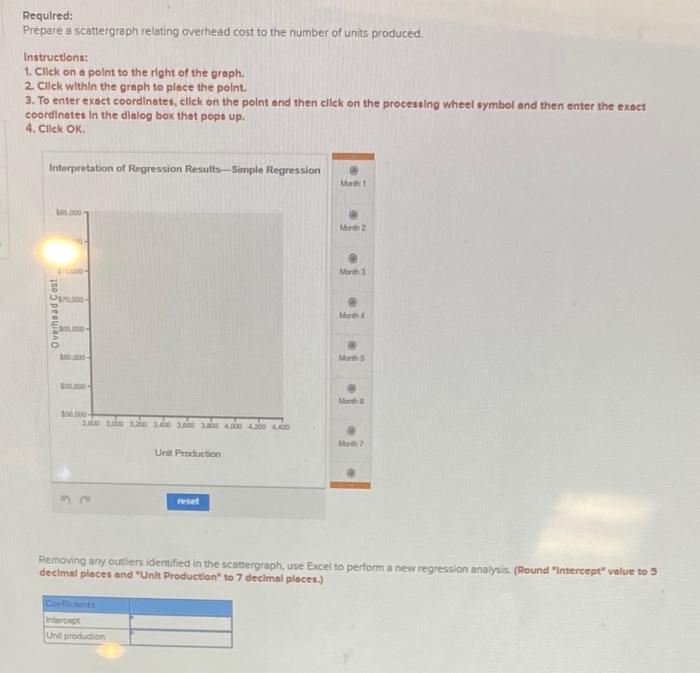
Your company is preparing an estimate of its production costs for the coming period. The controller estimates that direct materials costs are $70 per unit and that direct labor costs are $28 per hour. Estimating overhead, which is applied on the basis of direct labor costs, is difficult The controlle's office estimated overhead costs at $4,500 for fixed costs and $22 per unit for variable costs. Your colleague, Lance, who graduated from a rival school, has already done the analysis and reports the "correct" cost equation as follows. Overhead =$9,659+/ per unit Lance also reports that the correlation coefficient for the regression is 0.80 and says, "With 80% of the variation in overhead explained by the equation, it certainly should be adopted as the best basis for estimating costs." When asked for the data used to generate the regression, Lance produces the following: The company controller is somewhat surprised that the cost estimates are so different. You have therefore been assigned to check Lance's equation. You accept the assignment with glee. Required: Prepare a scattergraph relating overhead cost to the number of units produced. Required: Prepare a scattergraph relating overhead cost to the number of units produced. Instructlons: 1. Cllek on a polnt to the right of the greph. 2. Click wlthin the graph to plece the point. 3. To enter exact coordinates, cilck on the point end then click on the processing wheel symbol and then enter the exact coordinates In the dlalog box that popt up. 4. Click OK. Removing any outiers identified in the scattergraph, use Excel to perform a new regression analysia (Round "Intereept" value to 3 decimal ploces and "Unit Productlon" to 7 decimal ploces.) What 8 the coit equition with ihe newresuts? [Round varsabie conts per wilt to 2 decimet pleces]