

Answered step by step
Verified Expert Solution
Question
1 Approved Answer
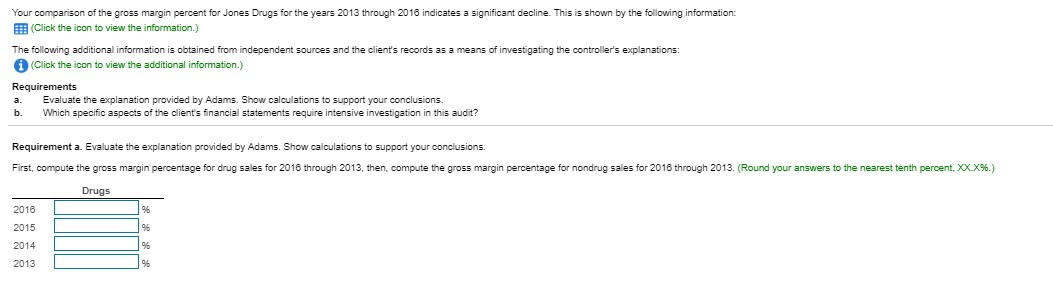
Your comparison of the gross margin percent for Jones Drugs for the years 2013 through 2016 indicates a significant decline. This is shown by the
Step by Step Solution
There are 3 Steps involved in it
Step: 1

Get Instant Access to Expert-Tailored Solutions
See step-by-step solutions with expert insights and AI powered tools for academic success
Step: 2

Step: 3
Ace Your Homework with AI
Get the answers you need in no time with our AI-driven, step-by-step assistance
Get Started
Horngrens Financial And Managerial Accounting The Managerial Chapters And The Financial Chapters Plus Pearson Mylab Accounting With Pearson Global Edition
Authors: Tracie L. Miller Nobles, Brenda L. Mattison, Ella Mae Matsumura
6th Global Edition
1292270756, 978-1292270753