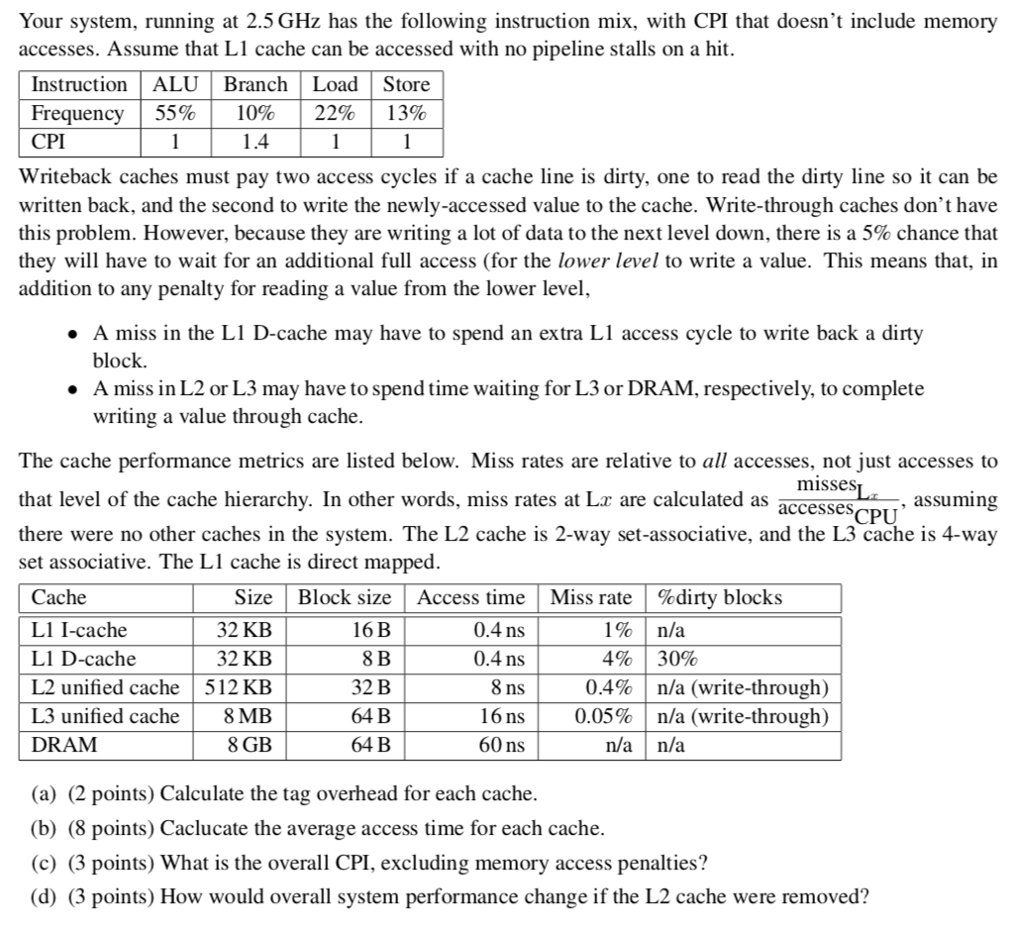
Your system, running at 2.5 GHz has the following instruction mix, with CPI that doesn't include memory accesses. Assume that L1 cache can be accessed with no pipeline stalls on a hit. Instruction ALU Branch Load Store Frequency | 55% | 10% | 22% | 13% CPI Writeback caches must pay two access cycles if a cache line is dirty, one to read the dirty line so it can be written back, and the second to write the newly-accessed value to the cache. Write-through caches don't have this problem. However, because they are writing a lot of data to the next level down, there is a 5% chance that they will have to wait for an additional full access (for the lower level to write a value. This means that, in addition to any penalty for reading a value from the lower level . A miss in the L1 D-cache may have to spend an extra L1 access cycle to write back a dirty block A miss in L2 or L3 may have to spend time waiting for L3 or DRAM, respectively, to complete writing a value through cache. . The cache performance metrics are listed below. Miss rates are relative to all accesses, not just accesses to that level of the cache hierarchy. In other words, miss rates at La are calculated as access there were no other caches in the system. The L2 cache is 2-way set-associative, and the L3 cache is 4-way set associative. The Ll cache is direct mapped misses , assuming es CPU Cache Ll I-cache L1 D-cache L2 unified cache | 5 12 KB L3 unified cache 8MB DRAM Size | Block size | Access time Miss rate | %dirty blocks 32 KB 32 KB 16B 8B 32 B 64B 64 B 0.4 ns 0.4 ns 1% 4% 0.4% 0.05% | n/a | 30% | n/a (write-through) | n/a (write-through) 8 ns 16 ns| 60 ns 8 GB n/a n/a (a) (2 points) Calculate the tag overhead for each cache. (b) (8 points) Caclucate the average access time for each cache. (c) (3 points) What is the overall CPI, excluding memory access penalties? (d) (3 points) How would overall system performance change if the L2 cache were removed? Your system, running at 2.5 GHz has the following instruction mix, with CPI that doesn't include memory accesses. Assume that L1 cache can be accessed with no pipeline stalls on a hit. Instruction ALU Branch Load Store Frequency | 55% | 10% | 22% | 13% CPI Writeback caches must pay two access cycles if a cache line is dirty, one to read the dirty line so it can be written back, and the second to write the newly-accessed value to the cache. Write-through caches don't have this problem. However, because they are writing a lot of data to the next level down, there is a 5% chance that they will have to wait for an additional full access (for the lower level to write a value. This means that, in addition to any penalty for reading a value from the lower level . A miss in the L1 D-cache may have to spend an extra L1 access cycle to write back a dirty block A miss in L2 or L3 may have to spend time waiting for L3 or DRAM, respectively, to complete writing a value through cache. . The cache performance metrics are listed below. Miss rates are relative to all accesses, not just accesses to that level of the cache hierarchy. In other words, miss rates at La are calculated as access there were no other caches in the system. The L2 cache is 2-way set-associative, and the L3 cache is 4-way set associative. The Ll cache is direct mapped misses , assuming es CPU Cache Ll I-cache L1 D-cache L2 unified cache | 5 12 KB L3 unified cache 8MB DRAM Size | Block size | Access time Miss rate | %dirty blocks 32 KB 32 KB 16B 8B 32 B 64B 64 B 0.4 ns 0.4 ns 1% 4% 0.4% 0.05% | n/a | 30% | n/a (write-through) | n/a (write-through) 8 ns 16 ns| 60 ns 8 GB n/a n/a (a) (2 points) Calculate the tag overhead for each cache. (b) (8 points) Caclucate the average access time for each cache. (c) (3 points) What is the overall CPI, excluding memory access penalties? (d) (3 points) How would overall system performance change if the L2 cache were removed


