Answered step by step
Verified Expert Solution
Question
1 Approved Answer
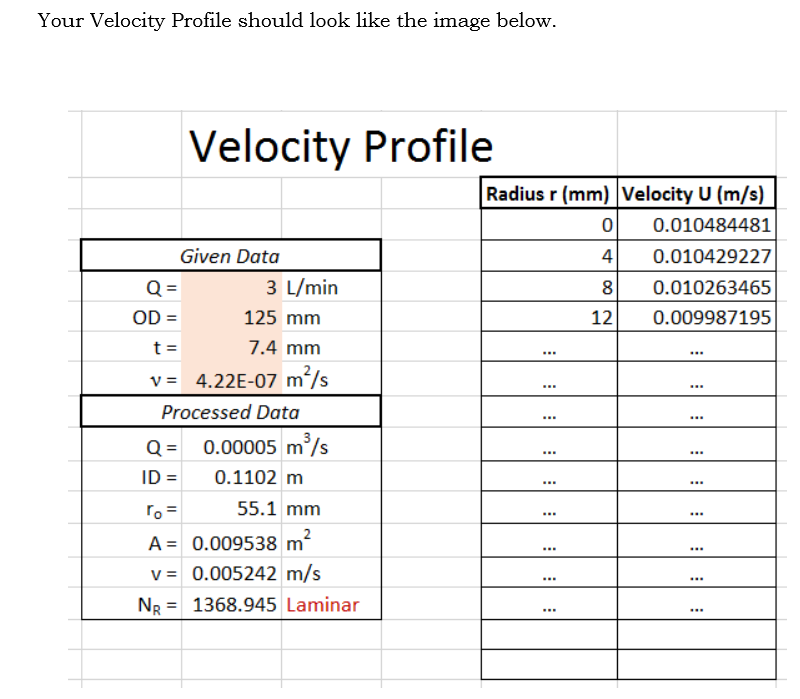
Your Velocity Profile should look like the image below. Velocity Profile Radius r (mm) Velocity U (m/s) Given Data Q= 3 L/min OD =


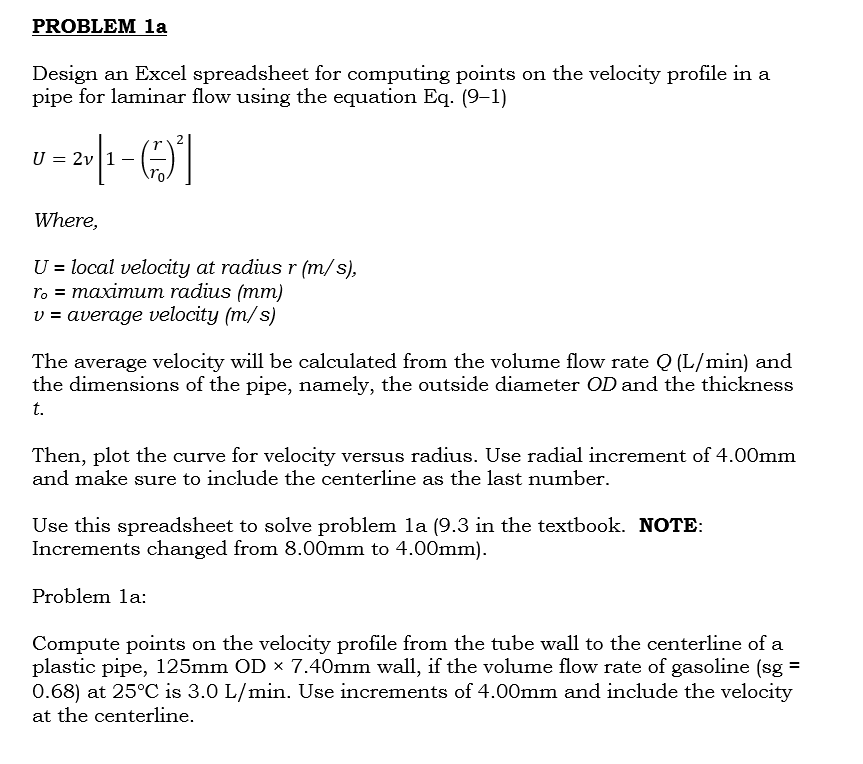
Your Velocity Profile should look like the image below. Velocity Profile Radius r (mm) Velocity U (m/s) Given Data Q= 3 L/min OD = 125 mm t = 7.4 mm v = 4.22E-07 m/s Processed Data Q= 0.00005 m/s ID= 0.1102 m ro= 55.1 mm A = 0.009538 m v = 0.005242 m/s NR = 1368.945 Laminar 0.010484481 4 0.010429227 8 0.010263465 12 0.009987195 ... PROBLEM la Design an Excel spreadsheet for computing points on the velocity profile in a pipe for laminar flow using the equation Eq. (9-1) U = 2v|1-(+)] Where, U = local velocity at radius r (m/s), ro = maximum radius (mm) v = average velocity (m/s) The average velocity will be calculated from the volume flow rate Q (L/min) and the dimensions of the pipe, namely, the outside diameter OD and the thickness t. Then, plot the curve for velocity versus radius. Use radial increment of 4.00mm and make sure to include the centerline as the last number. Use this spreadsheet to solve problem 1a (9.3 in the textbook. NOTE: Increments changed from 8.00mm to 4.00mm). Problem 1a: Compute points on the velocity profile from the tube wall to the centerline of a plastic pipe, 125mm OD 7.40mm wall, if the volume flow rate of gasoline (sg = 0.68) at 25C is 3.0 L/min. Use increments of 4.00mm and include the velocity at the centerline.
Step by Step Solution
There are 3 Steps involved in it
Step: 1

Get Instant Access to Expert-Tailored Solutions
See step-by-step solutions with expert insights and AI powered tools for academic success
Step: 2

Step: 3

Ace Your Homework with AI
Get the answers you need in no time with our AI-driven, step-by-step assistance
Get Started


