Consider the half-hourly electricity demands of Mondays in Adelaide, Australia, from July 6, 1997 to March 31,
Question:
Consider the half-hourly electricity demands of Mondays in Adelaide, Australia, from July 6, 1997 to March 31, 2007. The data are available from the fds package of R. See Hyndman (2016). There are 48 observations in a day and 508 weeks. The original data consist of demands from Sunday to Saturday, but we focus here on Monday only. Since the demands have an upward trend so we focus on xt = (1 − B48)dt with dt denoting the demand. Use the commands below to obtain the xt series.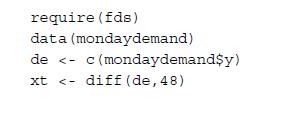
(a) Perform discrete wavelet transform of xt using six levels and the symmlet-8 wavelet. Show the plot and eda.plot, as in Example 3.6.
(b) Repeat part
(a) using the Haar wavelet.
(c) Perform a reconstruction using hard thresholding, as in Example 3.6.
Step by Step Answer:

This question has not been answered yet.
You can Ask your question!