Question:
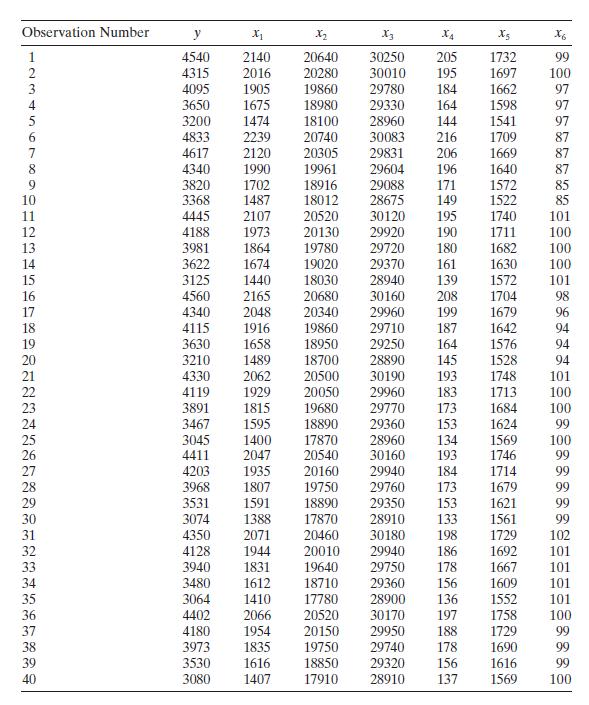
Consider the jet turbine engine thrust data in Table B.13. Split the data into prediction and estimation data sets.

a. Fit a model to the estimation data using all possible regressions. Select the minimum \(C_{p}\) model.
b. Use the model in part a to predict each observation in the prediction data set. Calculate \(R^{2}\) for prediction. Comment on model adequacy.
Transcribed Image Text:
Observation Number y X X2 X3 X4 X5 X6 1 4540 2140 20640 30250 205 1732 99 2 4315 2016 20280 30010 195 1697 100 3. 4095 1905 19860 29780 184 1662 97 4 3650 1675 18980 29330 164 1598 97 3200 1474 18100 28960 144 1541 97 34 6789012RASST253385233335 4833 2239 20740 30083 216 1709 87 4617 2120 20305 29831 206 1669 87 4340 1990 19961 29604 196 1640 87 3820 1702 18916 29088 171 1572 85 3368 1487 18012 28675 149 1522 85 11 4445 2107 20520 30120 195 1740 101 4188 1973 20130 29920 190 1711 100 3981 1864 19780 29720 180 1682 100 14 3622 1674 19020 29370 161 1630 100 3125 1440 18030 28940 139 1572 101 4560 2165 20680 30160 208 1704 98 4340 2048 20340 29960 199 1679 96 4115 1916 19860 29710 187 1642 94 3630 1658 18950 29250 164 1576 94 3210 1489 18700 28890 145 1528 94 4330 2062 20500 30190 193 1748 101 4119 1929 20050 29960 183 1713 100 3891 1815 19680 29770 173 1684 100 24 3467 1595 18890 29360 153 1624 99 3045 1400 17870 28960 134 1569 100 4411 2047 20540 30160 193 1746 99 4203 1935 20160 29940 184 1714 3968 1807 19750 29760 173 1679 3531 1591 18890 29350 153 1621 3074 1388 17870 28910 133 1561 99 4350 2071 20460 30180 198 1729 102 4128 1944 20010 29940 186 1692 101 3940 1831 19640 29750 178 1667 101 3480 1612 18710 29360 156 1609 101 3064 1410 17780 28900 136 1552 101 4402 2066 20520 30170 197 1758 100 4180 1954 20150 29950 188 1729 99 38 3973 1835 19750 29740 178 1690 99 39 3530 1616 18850 29320 156 1616 99 40 3080 1407 17910 28910 137 1569 100


