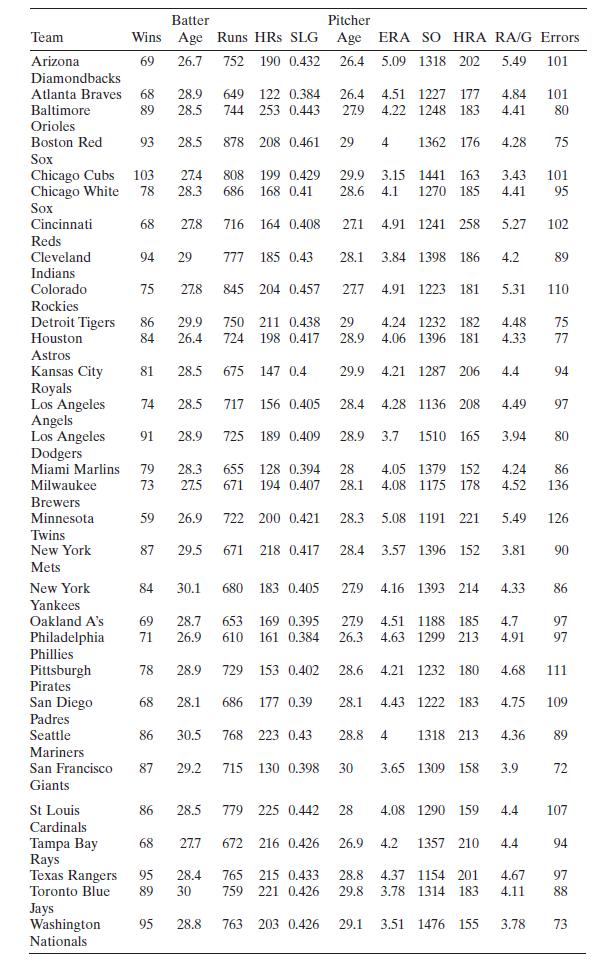
Consider the regression model fit to the baseball data in Table B.22, using team ERA to predict
Question:
Consider the regression model fit to the baseball data in Table B.22, using team ERA to predict the number of wins.

a. Construct a normal probability plot of the residuals. Is there any indication of a problem with the normality assumption?
b. Plot the residuals versus the predicted values and against the predictor variable ERA. Interpret these plots. Is there any indication of model inadequacy?
Transcribed Image Text:
Team Arizona 69 Batter Wins Age Runs HRS SLG 26.7 752 190 0.432 Pitcher Age ERA SO HRA RA/G Errors 26.4 5.09 1318 202 5.49 101 Diamondbacks Atlanta Braves 68 Baltimore 89 28.5 28.9 649 122 0.384 744 253 0.443 26.4 27.9 4.51 1227 177 4.84 101 4.22 1248 183 4.41 Orioles Boston Red 93 28.5 878 208 0.461 29 4 1362 176 4.28 Sox Chicago Cubs 103 27.4 Chicago White 78 28.3 686 808 199 0.429 168 0.41 29.9 28.6 3.15 1441 163 3.43 4.1 1270 185 4.41 95 Sox Cincinnati 68 27.8 716 164 0.408 271 4.91 1241 258 5.27 102 Reds Cleveland 94 29 777 185 0.43 28.1 3.84 1398 186 4.2 Indians Colorado 75 27.8 845 204 0.457 27.7 4.91 1223 181 5.31 Rockies Detroit Tigers 86 29.9 750 Houston 84 26.4 724 211 0.438 198 0.417 29 28.9 4.24 1232 182 4.06 1396 181 4.48 4.33 Astros Kansas City 81 28.5 675 147 0.4 29.9 4.21 1287 206 4.4 Royals Los Angeles 74 28.5 717 156 0.405 28.4 4.28 1136 208 4.49 Angels Los Angeles 91 28.9 725 189 0.409 28.9 3.7 1510 165 3.94 $ c 80 75 101 89 110 75 77 94 97 80 Dodgers Miami Marlins Milwaukee NE 79 28.3 655 73 27.5 671 128 0.394 194 0.407 28 28.1 4.05 1379 152 4.08 1175 178 4.24 4.52 136 Brewers Minnesota 59 26.9 722 200 0.421 28.3 5.08 1191 221 5.49 Twins New York 87 29.5 671 218 0.417 28.4 3.57 1396 152 3.81 Mets New York 84 30.1 680 183 0.405 27.9 4.16 1393 214 4.33 Yankees Oakland A's 69 28.7 Philadelphia 71 26.9 653 169 0.395 610 161 0.384 27.9 26.3 4.51 1188 185 4.7 4.63 1299 213 4.91 Phillies Pittsburgh 78 28.9 729 153 0.402 28.6 4.21 1232 180 4.68 111 Pirates San Diego 68 28.1 686 177 0.39 28.1 4.43 1222 183 4.75 109 Padres Seattle 86 30.5 768 223 0.43 28.8 4 1318 213 4.36 Mariners San Francisco 87 29.2 715 130 0.398 30 3.65 1309 158 3.9 = 86 126 90 86 97 97 89 72 Giants St Louis 86 28.5 779 225 0.442 28 4.08 1290 159 4.4 107 Cardinals Tampa Bay 68 27.7 672 216 0.426 26.9 4.2 1357 210 4.4 Rays Texas Rangers 95 28.4 Toronto Blue 89 30 765 215 0.433 759 221 0.426 28.8 4.37 1154 201 4.67 29.8 3.78 1314 183 4.11 Jays Washington 95 28.8 763 203 0.426 29.1 3.51 1476 155 3.78 94 97 88 73 Nationals
Step by Step Answer:

This question has not been answered yet.
You can Ask your question!
Related Book For 

Introduction To Linear Regression Analysis
ISBN: 9781119578727
6th Edition
Authors: Douglas C. Montgomery, Elizabeth A. Peck, G. Geoffrey Vining
Question Posted:
Students also viewed these Business questions
-
Consider the multiple linear regression model fit to the baseball data in Problem 3.41. Problem 3.41 Consider the 2016 major league baseball data in Table B.22. While team ERA was useful in...
-
Consider the regression model fit to the nisin extraction data in Exercise 12-18. (a) What proportion of total variability is explained by this model? (b) Construct a normal probability plot of the...
-
Consider the simple linear regression model fit to the rental price data from Problem 2.36. Data From Problem 2.36 Table B.24 contains data on median family home rental price and other data for 51 US...
-
As we continue our discussions regarding revenue's associated with public sector, this will help reinforce some of the ideas regarding taxes on goods and services. Through the next week, save your...
-
Tad, who owns and operates a business, acquired machinery and placed it in service in June 2005. The machinery is 10-year property. Does Tad make an AMT adjustment in 2005 and/or 2014 for the...
-
(a) State generalizations of Propositions 13 and 14 for the case of k independent Poisson r.v.s for the former proposition, and for the case of k types for the latter. (b) Prove the generalizations...
-
Know these terms. Explain in one sentence each what randomized, double-blind, and placebo-controlled mean in the description of the design of the study.
-
The Fisher Apparel Company balance sheet for the year ended 2006 is as follows: a. What is Fisher's investment in current assets? b. Determine Fisher's working capital investment. c. Determine...
-
i clonex labs incorporated uses the weighted - Google Search Help Save & Exit Clonex Labs, Incorporated, uses the FIFO method of process costing. The following data are available for one department...
-
Consider the multiple linear regression model fit to the rental price data in Problem 3.42. Problem 3.42 Table B.24 contains data on median family home rental price and other data for 51 US cities....
-
Consider the methanol oxidation data in Table B.20. Perform a thorough analysis of these data. What conclusions do you draw from this residual analysis? x x2 X3 X4 0 454 8.8 3.90 1.30 1.1 0 474 8.2...
-
To appreciate the need to move from performance appraisal to performance management
-
Hey i need the following pages done ASAP.Please and thank you D2L Lesson 1: Electrostatics - Physics X L1Electrostatics X Course Hero +...
-
Bed & Bath, a retailing company, has two departmentsHardware and Linens. The companys most recent monthly contribution format income statement follows: Department Total Hardware Linens Sales $...
-
Use the formula g'(a) = lim. [(g(x)-g(a) )/ (x-a) ] x-->a to find g'(x) for g(x) = srqrt(x+7). Find the equation fo the tangrnt line to g(x) at x =-5
-
As shown in the figure below, an incompressible liquid flows steadily and vertically upward in a circular cross-sectional pipe. At section (1), the velocity profile over the cross-sectional area is...
-
writE a paper on teamwork 1. Share an experience with working on teamwork during your academic journey or on the job. 2. Share both positive and negative experiences. 3. What are your suggestions...
-
The state gas tax in cents per gallon for 25 states is given below. Construct a grouped frequency distribution and a cumulative frequency distribution with 5 classes. 7.5 16 23.5 17 22 21.5 19 20...
-
Explain the circumstances that could result in a long-term bank loan being shown in a statement of financial position as a current liability.
-
Chapter o Homew ebook 50,000-unit production quantity: $ 227,049 7 70,000-unit production quantity: $ 66,751 d. In addition to mean profit, what other factors should FTC consider in determining a...
-
Diamond makes downhill ski equipment. Assume that comic has offered to produce ski poles for Diamond for $20 per pair Diamond needs 200,000 pairs of poles per period Diamond can only avoid 5150,000...
-
17? Which of the following statement is true Select one: a. All evidence must have the same level of reliability b. All evidence must have the same level of persuasiveness C. All are false d....

Study smarter with the SolutionInn App


