Question:
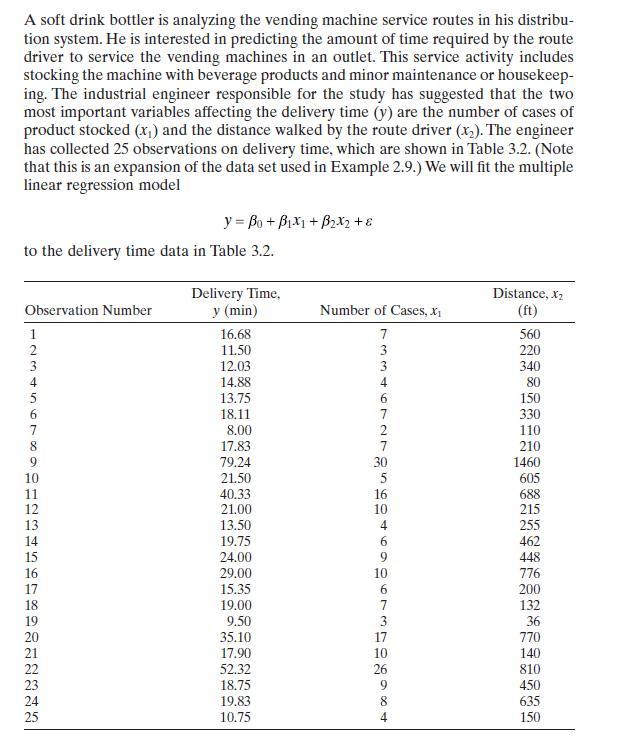
Consider the soft drink delivery time data in Example 3.1. Find the bootstrap estimate of the standard deviation of \(\hat{\beta}_{1}\) using the following numbers of bootstrap samples: \(m=100, m=200, m=300, m=400\), and \(m=500\). Can you draw any conclusions about how many bootstrap samples are necessary to obtain a reliable estimate of the precision of estimation for \(\hat{\beta}_{1}\) ?
Example 3.1

Transcribed Image Text:
A soft drink bottler is analyzing the vending machine service routes in his distribu- tion system. He is interested in predicting the amount of time required by the route driver to service the vending machines in an outlet. This service activity includes stocking the machine with beverage products and minor maintenance or housekeep- ing. The industrial engineer responsible for the study has suggested that the two most important variables affecting the delivery time (y) are the number of cases of product stocked (x) and the distance walked by the route driver (x2). The engineer has collected 25 observations on delivery time, which are shown in Table 3.2. (Note that this is an expansion of the data set used in Example 2.9.) We will fit the multiple linear regression model y=Bo+Bx1+B2x2 +8 to the delivery time data in Table 3.2. Observation Number Delivery Time, y (min) Distance, X2 Number of Cases, x (ft) 17 19 123456TORDIDAMANTRA 16.68 11.50 12.03 14.88. 13.75 18.11 8.00 8 17.83 9 79.24 10 21.50 11 40.33 16 21.00 10 13.50 19.75 24.00 29.00 10 15.35 18 19.00 9.50 20 35.10 17 21 17.90 10 22 52.32 26 23 18.75 24 19.83 25 10.75 733467ATOSCO469967EDO690 + 560 220 340 80 150 330 2 110 210 1460 5 605 688 215 255 462 448 776 200 132 36 770 140 810 450 8 635 4 150


